07/05/20
Blue Chip Daily Chart of the Week:
Alibaba, BABA
Close: $223.60
Stop level for position traders and investors: 196.46, below the rising 200-sma.
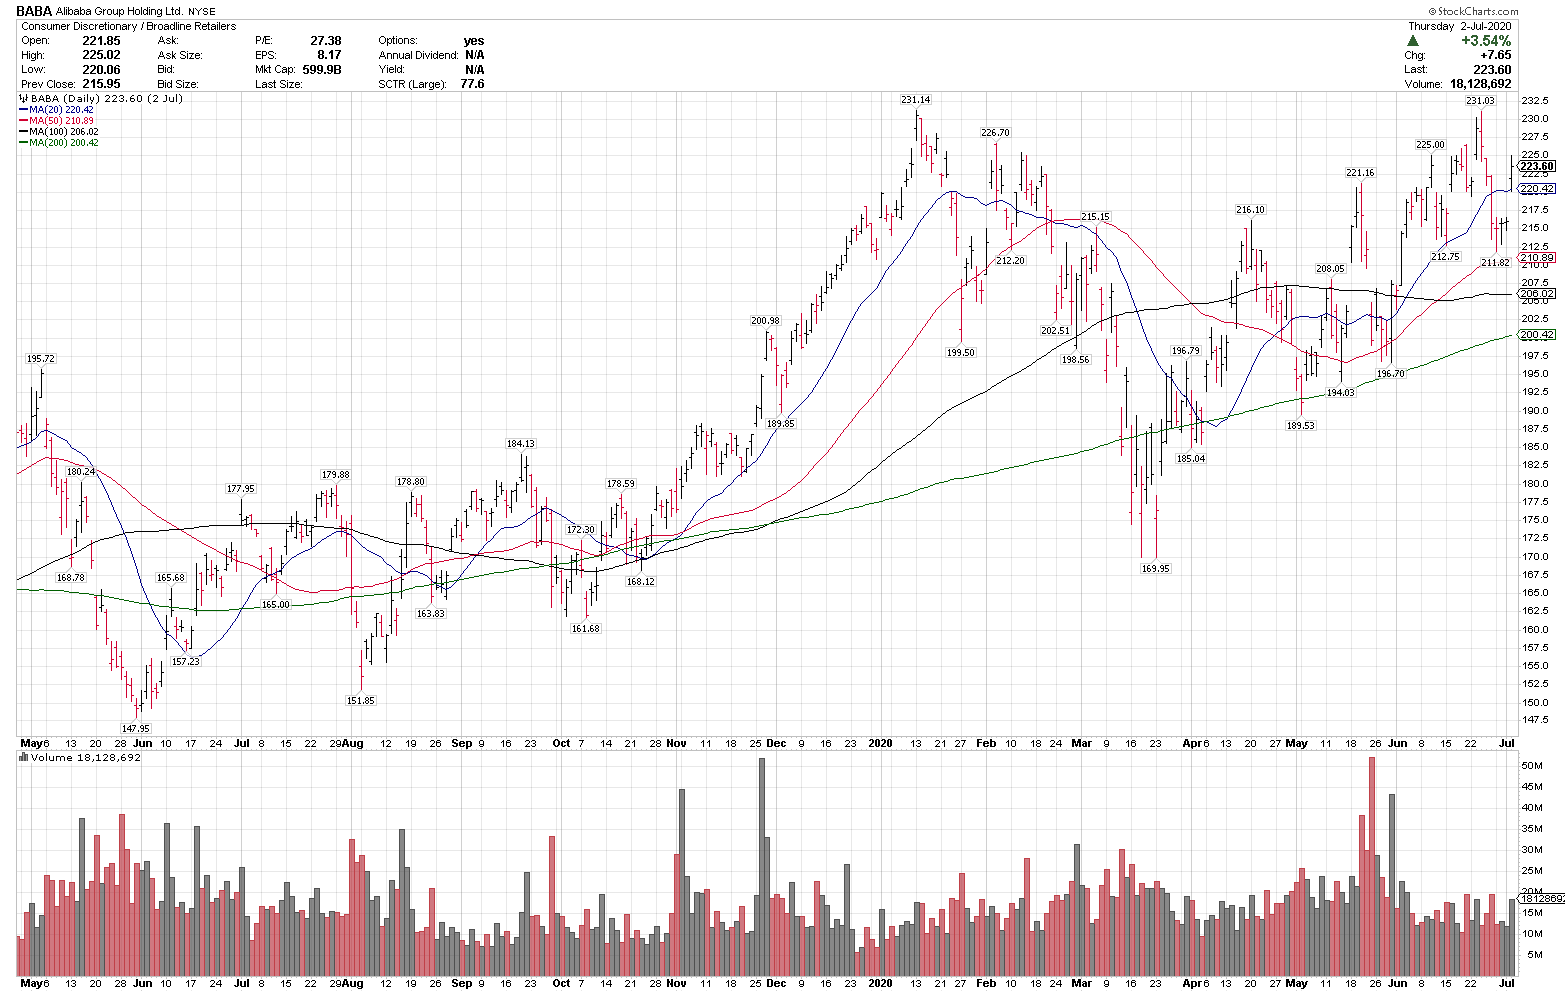
– BABA is in a primary uptrend, above the rising 20, 50 and 200-day moving averages.
– The rising moving averages indicate a strong uptrend on multiple time frames.
– The stock recently consolidated 8.3% and moved higher off the rising 50-dma, a sign of an intermediate term uptrend as well.
– BABA is on our newly published Top 20 Weekly Best Stock Ideas List this week for our subscribers.
– If BABA can clear 235, it could signal a new leg higher.
– Disclosure: I am currently long BABA.
Our Top 10 Trade Alerts in 2020 YouTube Video: https://youtu.be/4fnq78Ber00
Have a great week,
Larry Tentarelli
Publisher
https://bluechipdaily.com/disclaimer/