7/25/21
Blue Chip Daily Chart of the Week:
American Express, AXP
Close: 173.18
Stop level: 147.20
please see chart analysis below
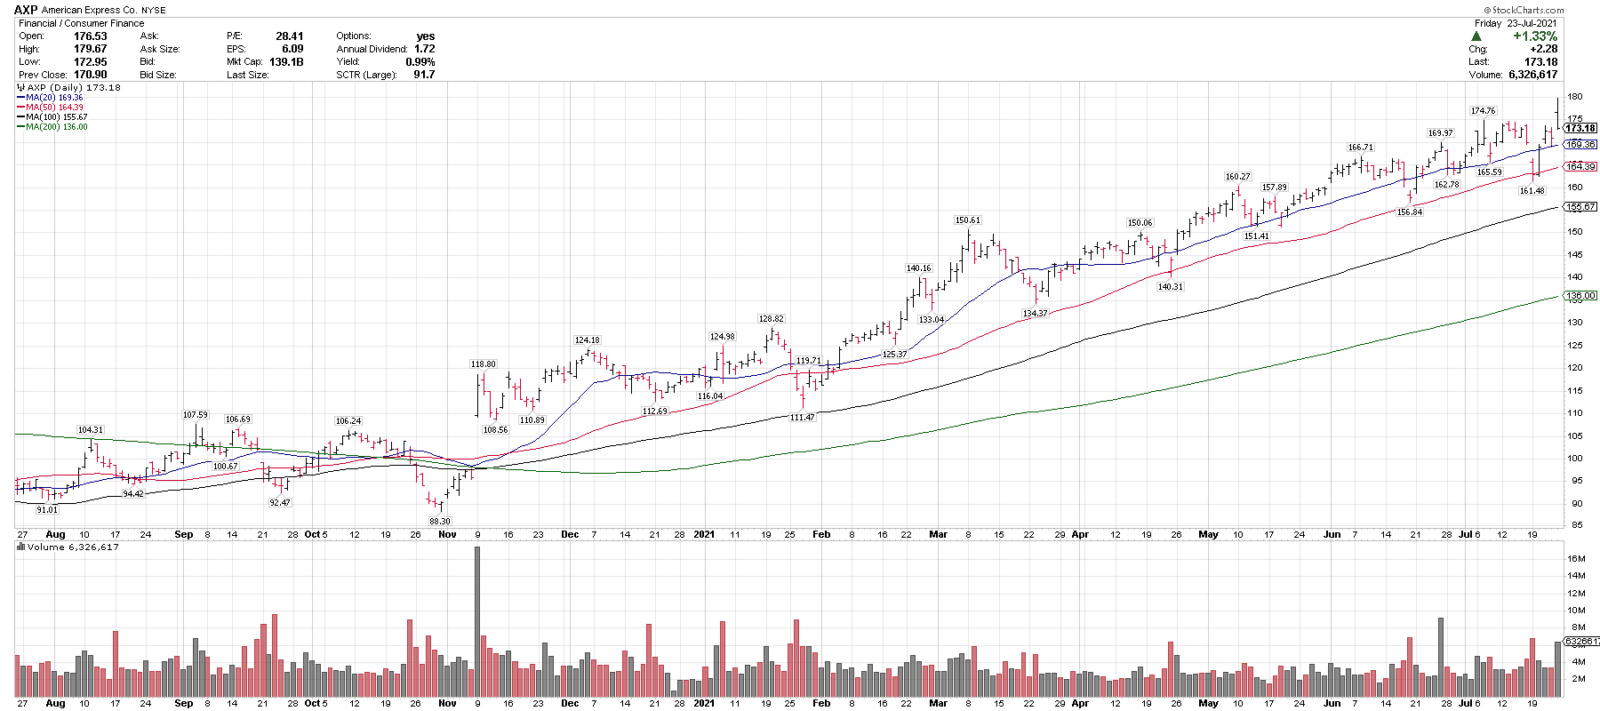
- American Express, AXP, is one of our top technical ideas going into the week and is on this week’s Members Top 25 list.
- AXP is trading over 4 rising moving averages, indicating an uptrend on multiple time frames and recently made a new all-time high.
- AXP has put in a series of higher highs and higher lows, in a lower volatility uptrend.
- AXP has been a performance leader in the Financial sector year-to-date.
- There is key support in the 160-165 range and a close over 180 could signal a breakout higher.
- Our Chart of the Week ideas are based on the stand alone chart, and are not a directional market call. Overall market direction can play a factor as well.
- AXP was on our Members Weekly Top 25 list recently as well on 5/23 and 7/04.
We alerted Blue Chip Daily Members to pullback buying opportunities in equity markets last week, near the lows, in real-time, as well as at the lows in May. This blog details some of our real-time posts and charts, and what I was seeing at the time:
Calling The May and July Pullback Lows in Real-Time + Charts – Blue Chip Daily Trend Report
To see this week’s Top 25 stocks list, with our best ideas across all S&P 500 sectors, please join here: https://bluechipdaily.com/join-blue-chip-daily/
Have a great week,
Larry Tentarelli
Publisher
Disclaimer – Blue Chip Daily Trend Report