5/23/21
Blue Chip Daily Chart of the Week:
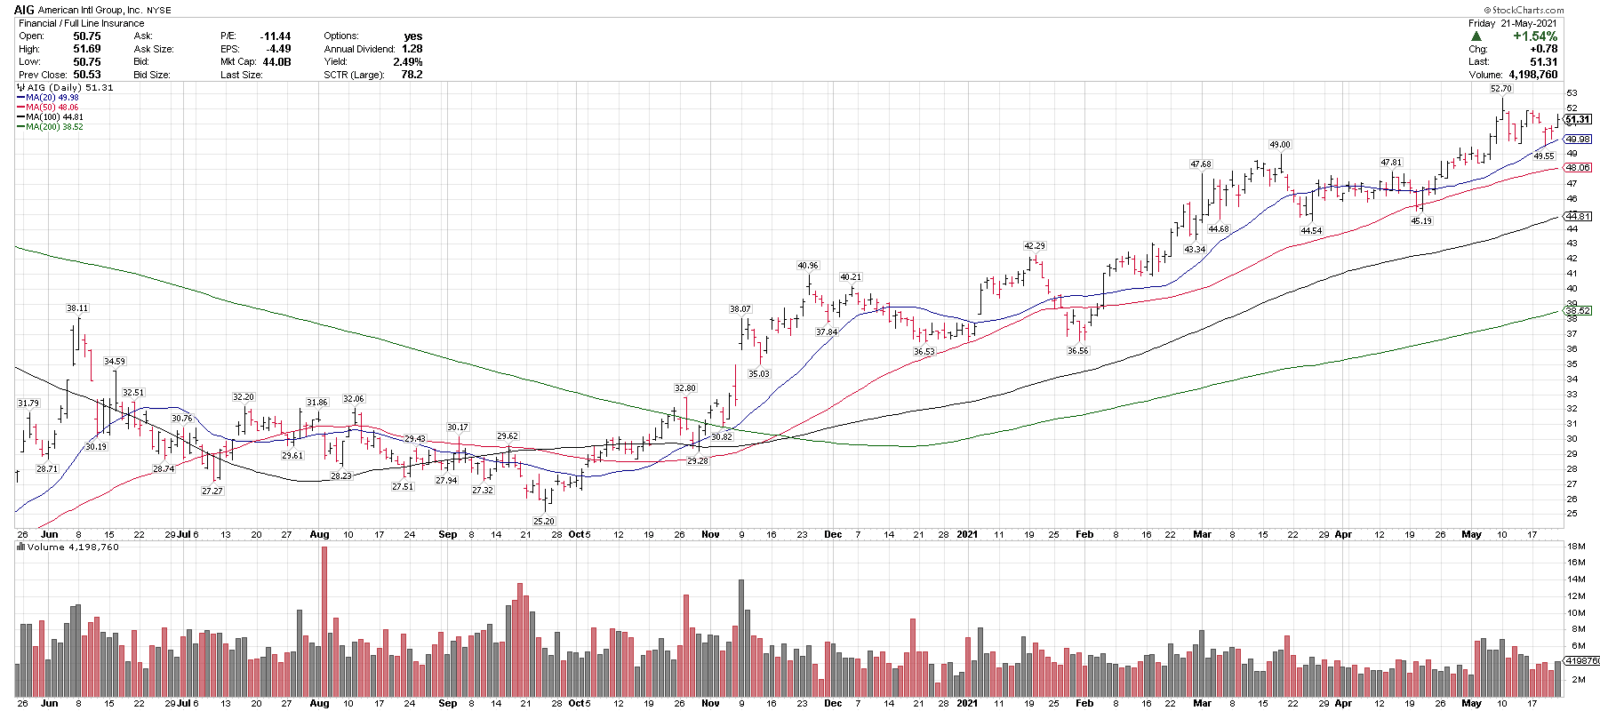
American International Group, (AIG)
Close: 51.31
Stop level for position traders and investors: 42.94
please see chart analysis below
- American International Group, (AIG), is one of our top technical ideas coming into the week, and is on this week’s Members Top 25 Stocks List.
- AIG is currently trading over rising 20, 50, 100 & 200-day moving averages, indicating an uptrend on multiple time frames.
- AIG recently pulled back 5.9% from 15-month highs, and held above the 20-sma.
- AIG has put in a consistent series of higher highs and higher lows, indicating a strong uptrend.
- 46-49 is a key support level and over 53 and 56 could signal a breakout higher.
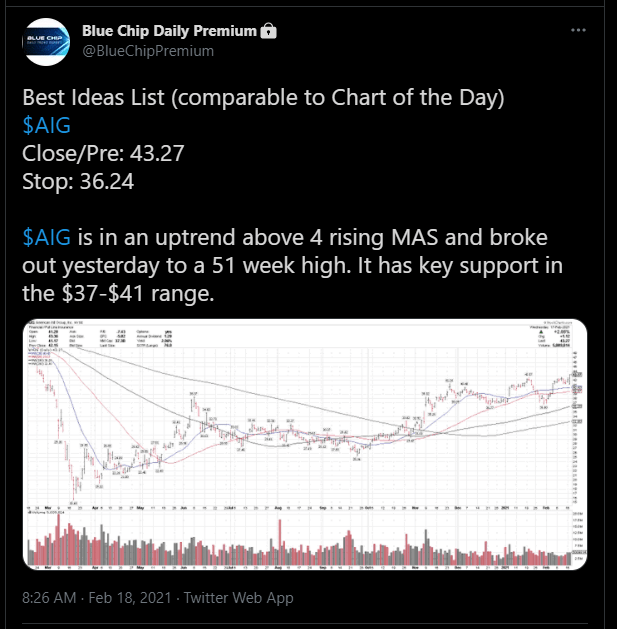
- AIG went onto our Best Ideas Buy List on 2/18/21 (below) and is +18% since. It also was featured again on our 5/20/21 Best Ideas List.
- Disclosure: I am currently long AIG.
Have a great week,
Larry Tentarelli
Publisher
Disclaimer – Blue Chip Daily Trend Report