9/27/20
Blue Chip Daily Chart of the Week:
Sea Ltd., SE
Close: $155.29
Stop level for position traders and investors: $134.32
please see chart analysis below
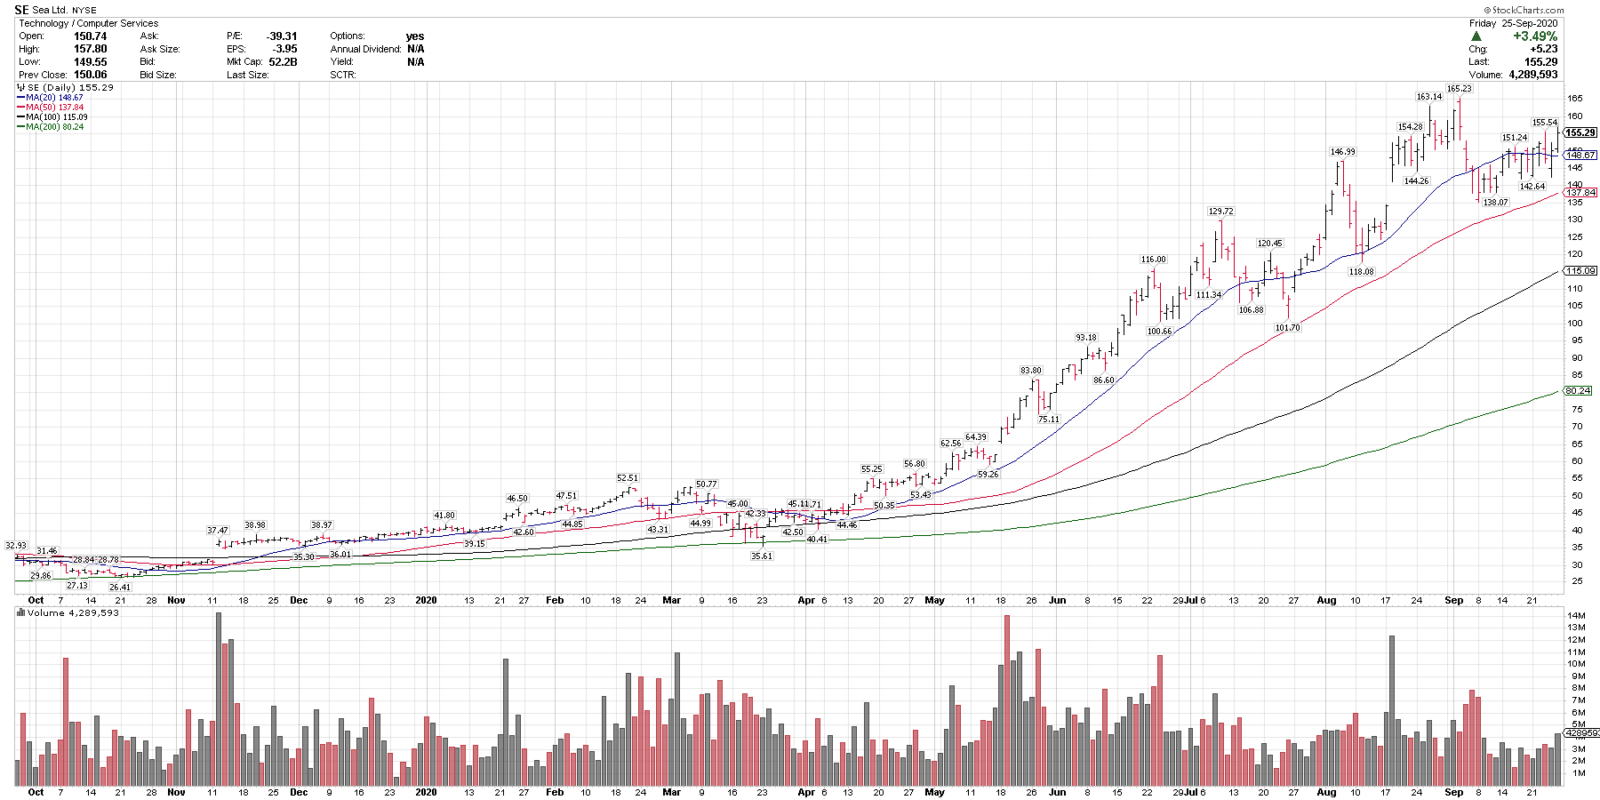
- Sea, (SE), is in a technical uptrend above the rising 20, 50, 100 & 200-sma, indicating an uptrend on multiple time frames.
- SE recently corrected 16.4% off all-time highs and held over the rising 50-sma.
- SE closed the week at an all-time weekly closing high, showing improving price momentum.
- The rising 50-sma is a key intermediate term trend gauge.
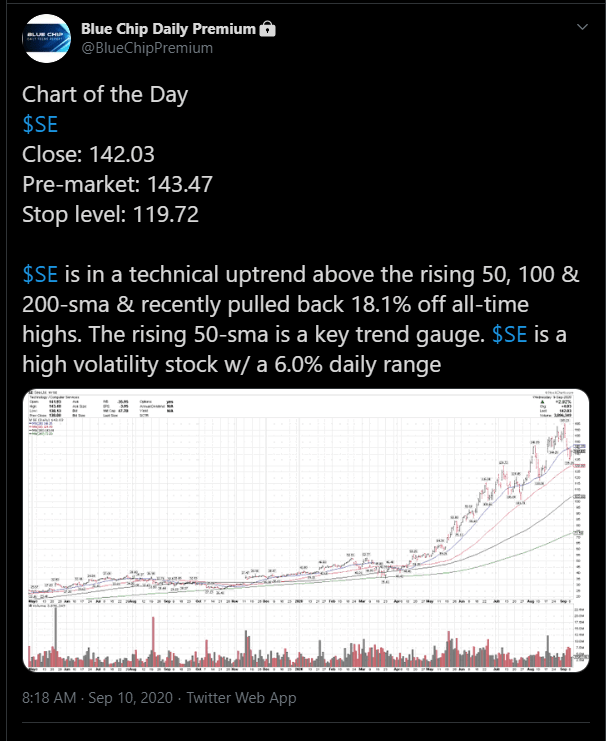
- SE went onto our Chart of the Day Buy List on Sept. 10 at $142.03 and was on last week’s and this week’s Top 25 Stocks Buy List, just published today.
- Disclosure: I am currently long SE.
- Join us now to get trade signals like the daily, before they break out and to get immediate access to my Top 25 large cap stock ideas right now, across a variety of industries. https://bluechipdaily.com/join-blue-chip-daily/
Have a great week,
Larry Tentarelli
Publisher