5/31/21
Blue Chip Daily Chart of the Week:
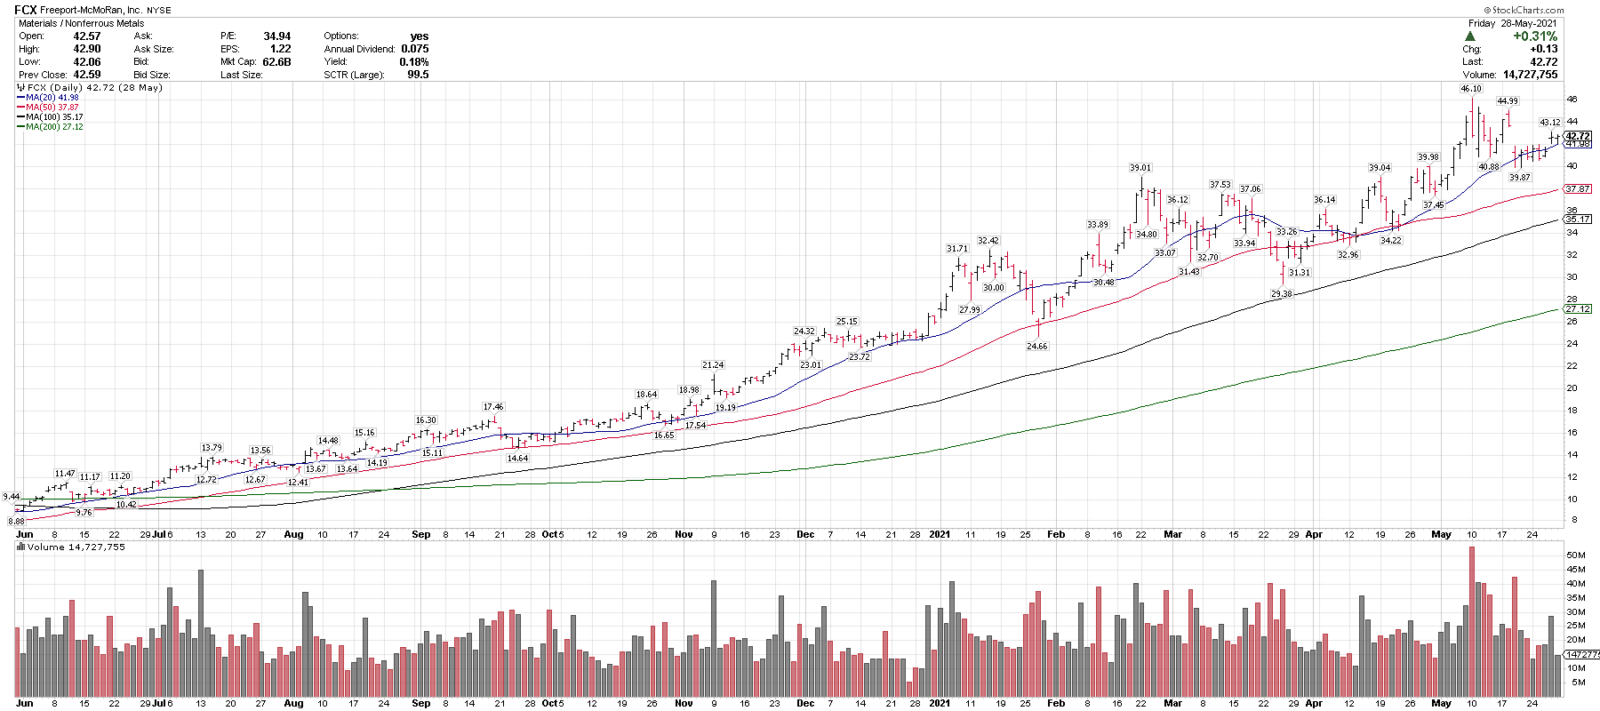
Freeport McMoran, FCX
Close: 42.72
Stop level for position traders and investors: 34.90 (a wider stop below the 100-sma for now, which can trail higher)
please see chart analysis below
- Freeport McMoran, (FCX) is one of our top technical ideas coming into the week, and is on this week’s Members Top 25 Stocks List.
- FCX is currently trading over rising 20, 50, 100 & 200-day moving averages, indicating an uptrend on multiple time frames.
- FCX recently pulled back 13.5% from 10-year highs, and held above the 50-sma.
- FCX is a higher than average volatility stock, but has remained in a steady uptrend over the 100-sma since June 2020.
- 36-40 is a key support level and over 46 could signal a breakout higher.
- Copper also broke out to a new all-time monthly closing high on Friday, which could bode well for FCX.
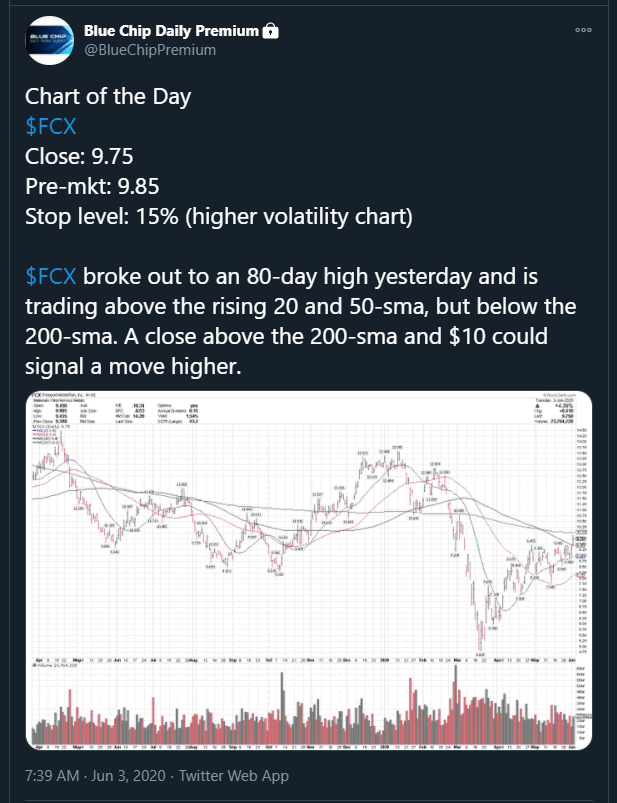
- FCX has been on our Chart of the Day list and Top 25 list repeatedly since first posted on 6/3/20 and it is currently +332% since then.
- Disclosure: I am currently long FCX.
Have a great week,
Larry Tentarelli
Publisher
Disclaimer – Blue Chip Daily Trend Report