I first posted this blog on 2/20/20, but have revised it on 9/18/21. https://twitter.com/LMT978/status/1230565044749914112
Below is the $SPX Daily Chart for every Bear Market (20% drawdown peak to trough) since 1980, 8 (now 9, to include the Feb/March 2020 decline).
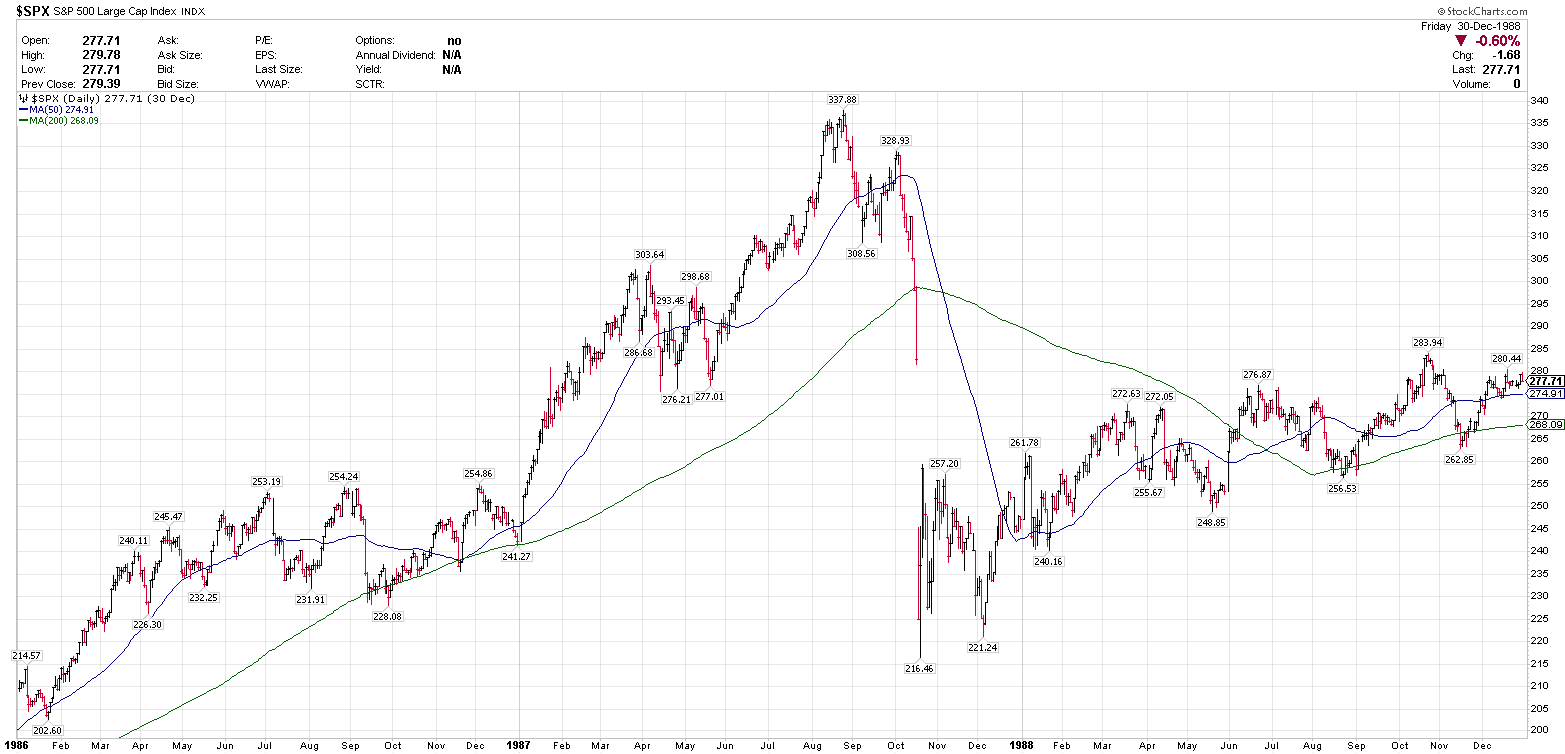
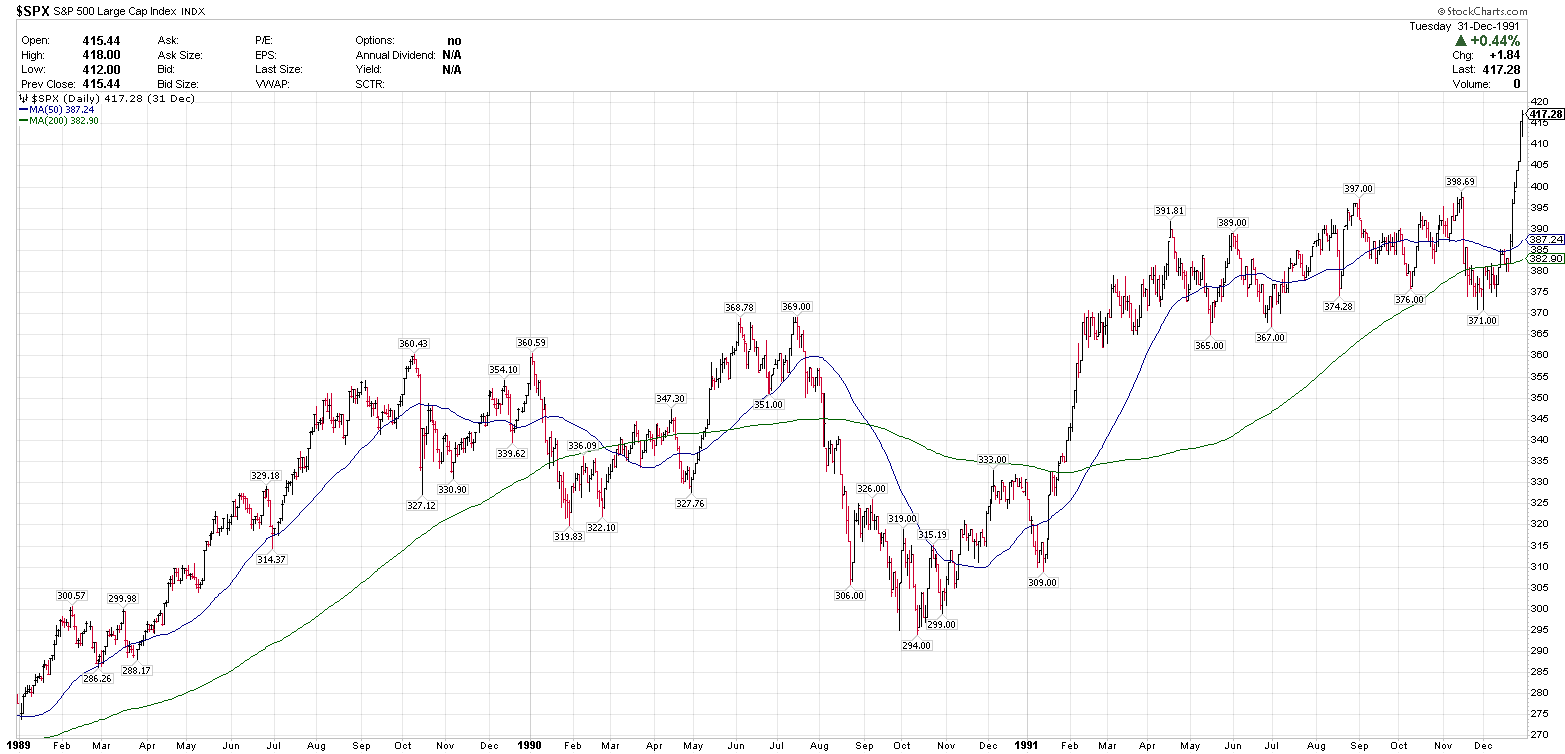
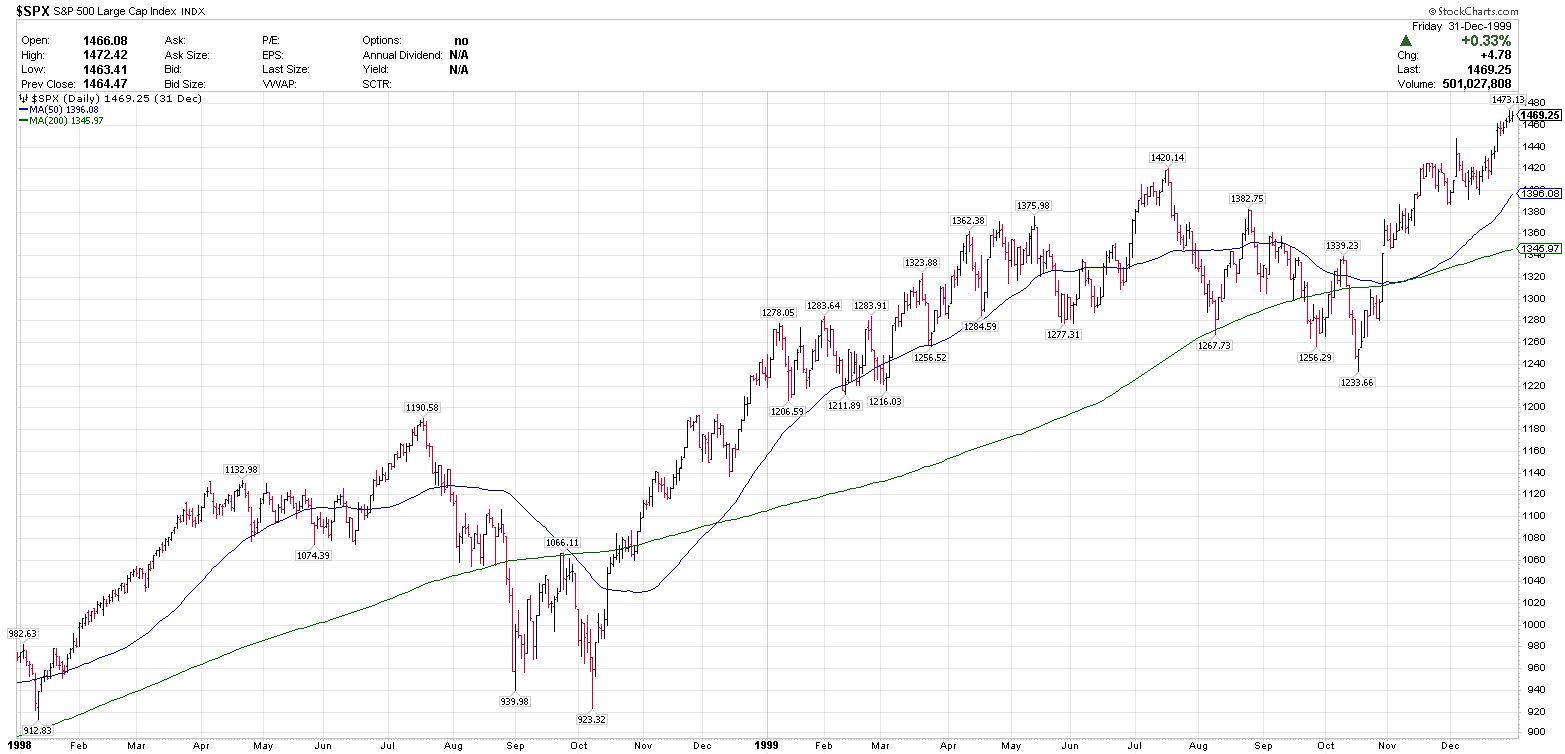
In every instance, $SPX broke the 50-sma first and then the 200-sma, even 1987, which was a 7-week unwind process going into Black Monday.
$SPX 1980-1982 BEAR MARKET
Peak: 141.96
Trough: 101.44
Drawdown: 28.5%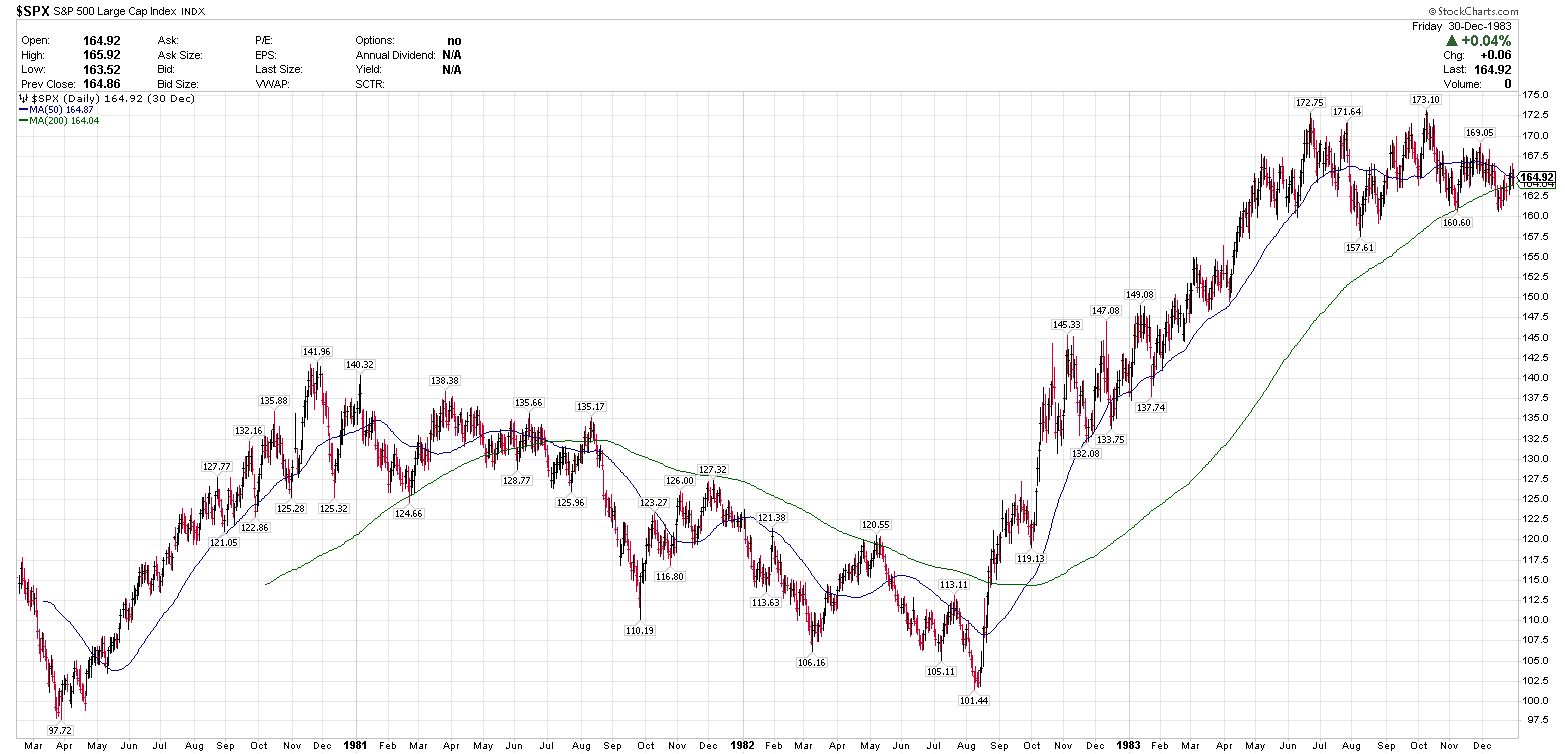
$SPX 1987 BEAR MARKET
Peak: 337.88
Trough: 216.46
Drawdown: 35.9%
$SPX 1990 BEAR MARKET
Peak: 369.00
Trough: 294.00
Drawdown: 20.3%
$SPX 1998 BEAR MARKET
Peak: 1190.58
Trough: 923.32
Drawdown: 22.4%
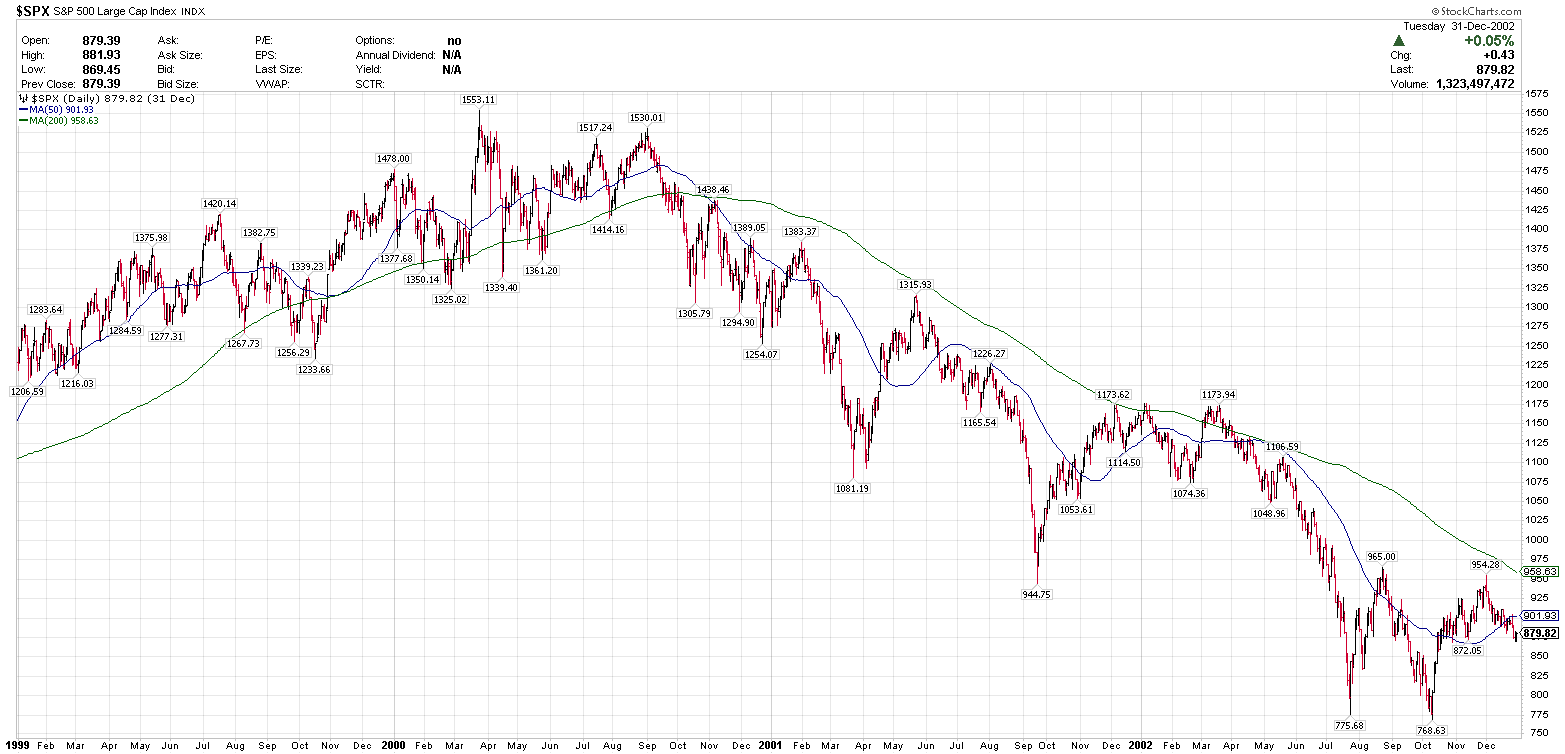
$SPX 2000 – 2003 BEAR MARKET
Peak: 1553.11
Trough: 768.63
Drawdown: 50.5%
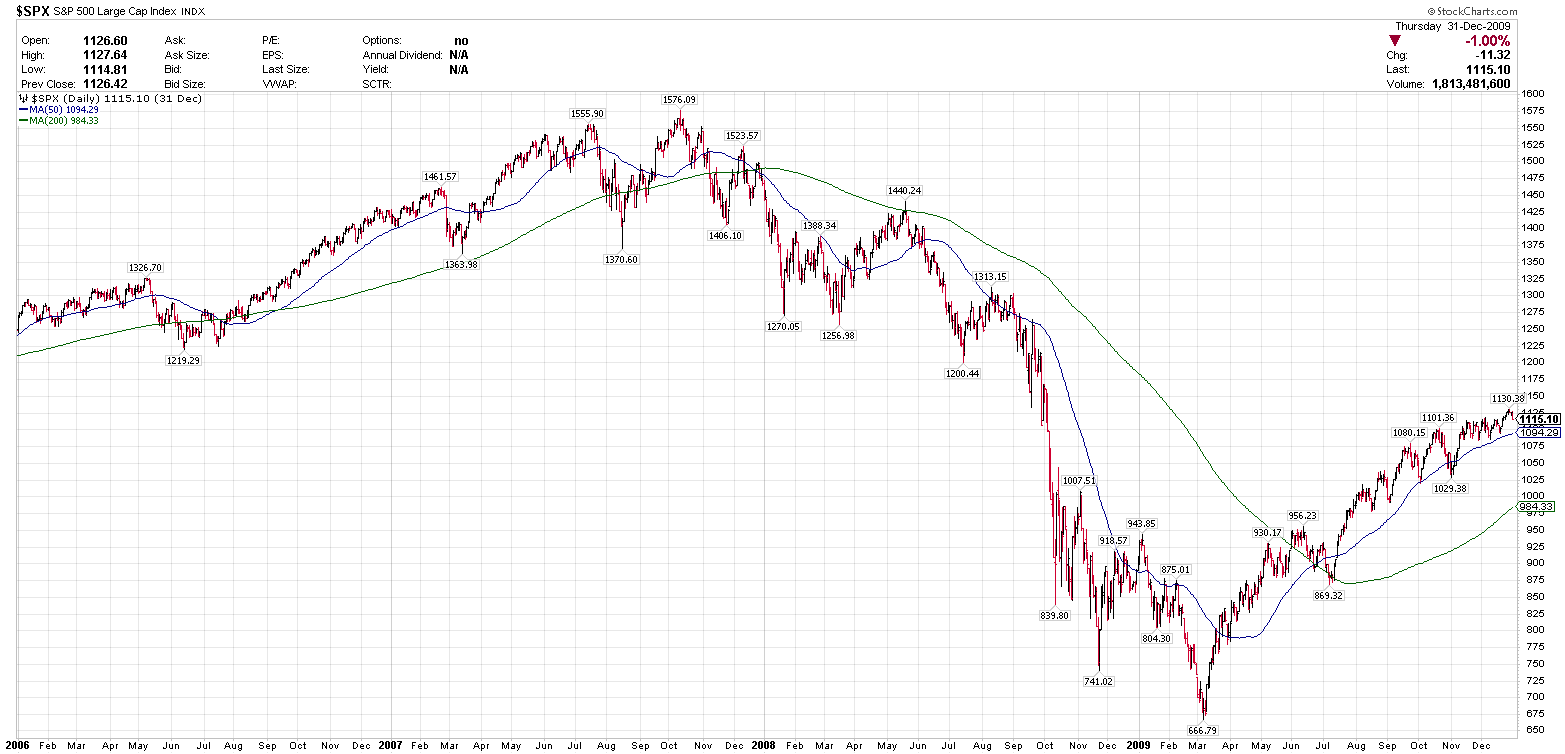
$SPX 2007 – 2009 BEAR MARKET
Peak: 1576.09
Trough: 666.79
Drawdown: 57.6%
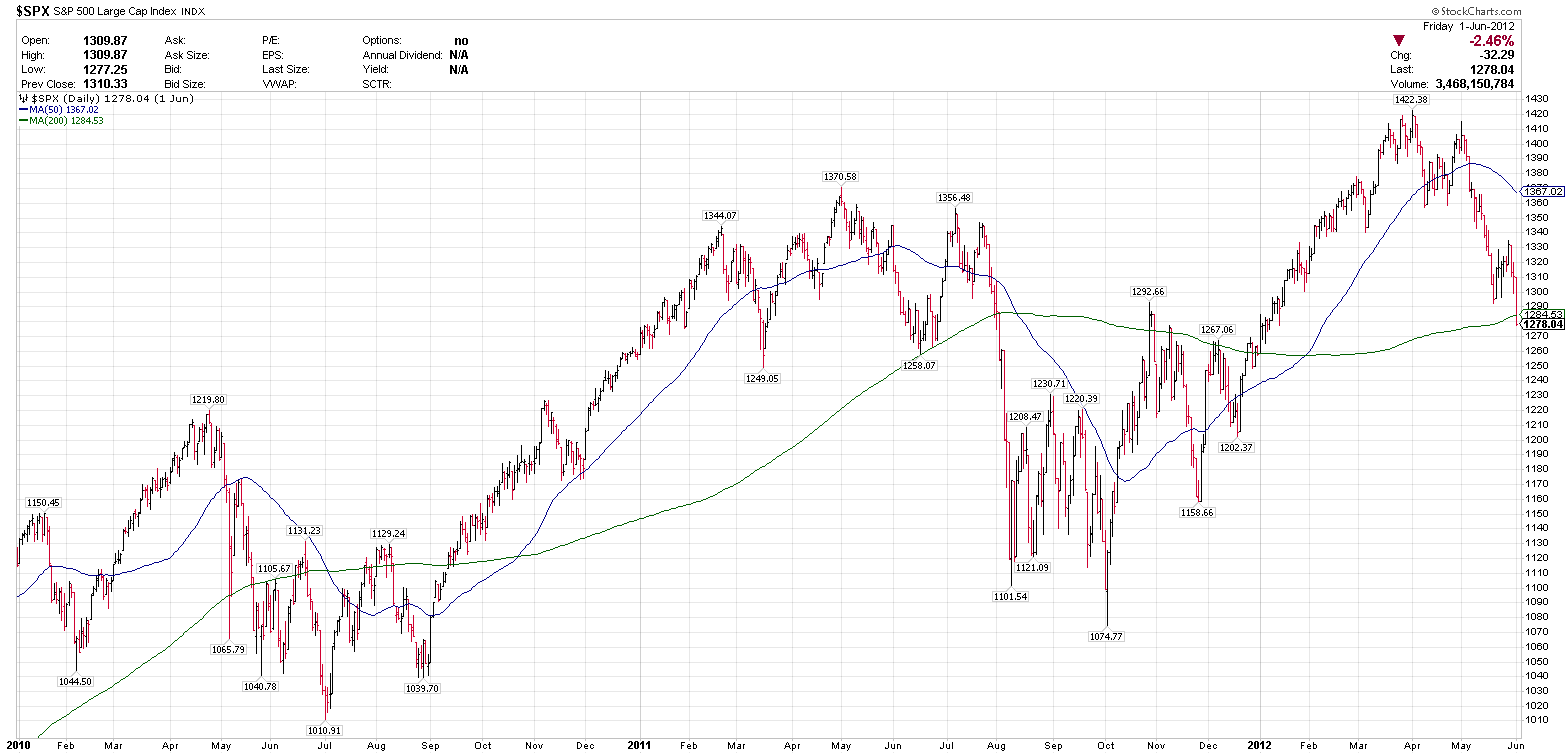
$SPX 2011 BEAR MARKET
Peak: 1370.58
Trough: 1074.77
Drawdown: 21.58%
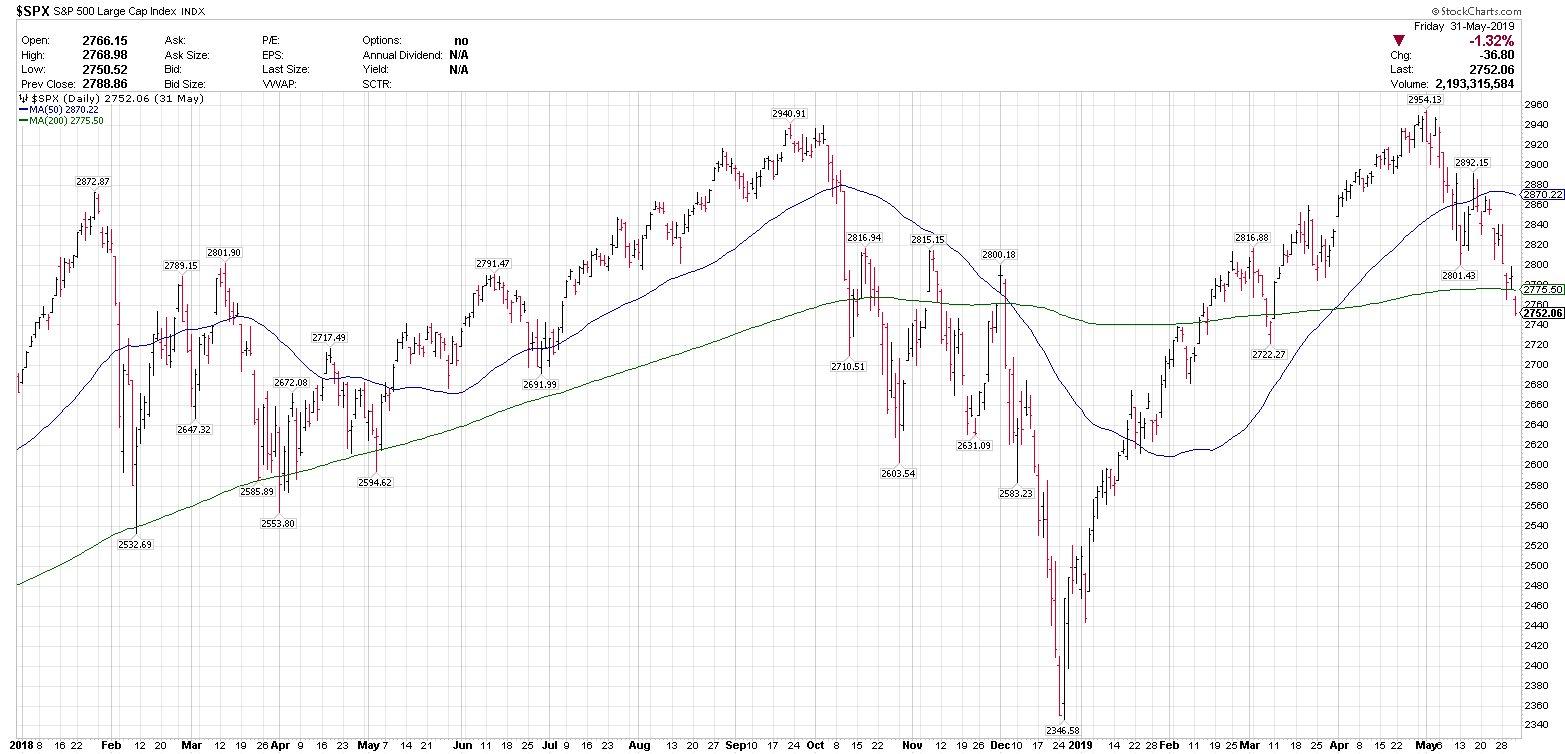
$SPX 2018 BEAR MARKET
Peak: 2940.91
Trough: 2346.58
Drawdown: 20.2%
SPX 2020 BEAR MARKET
Peak: 3393.52
Trough: 2191.86
Drawdown: 35.41%
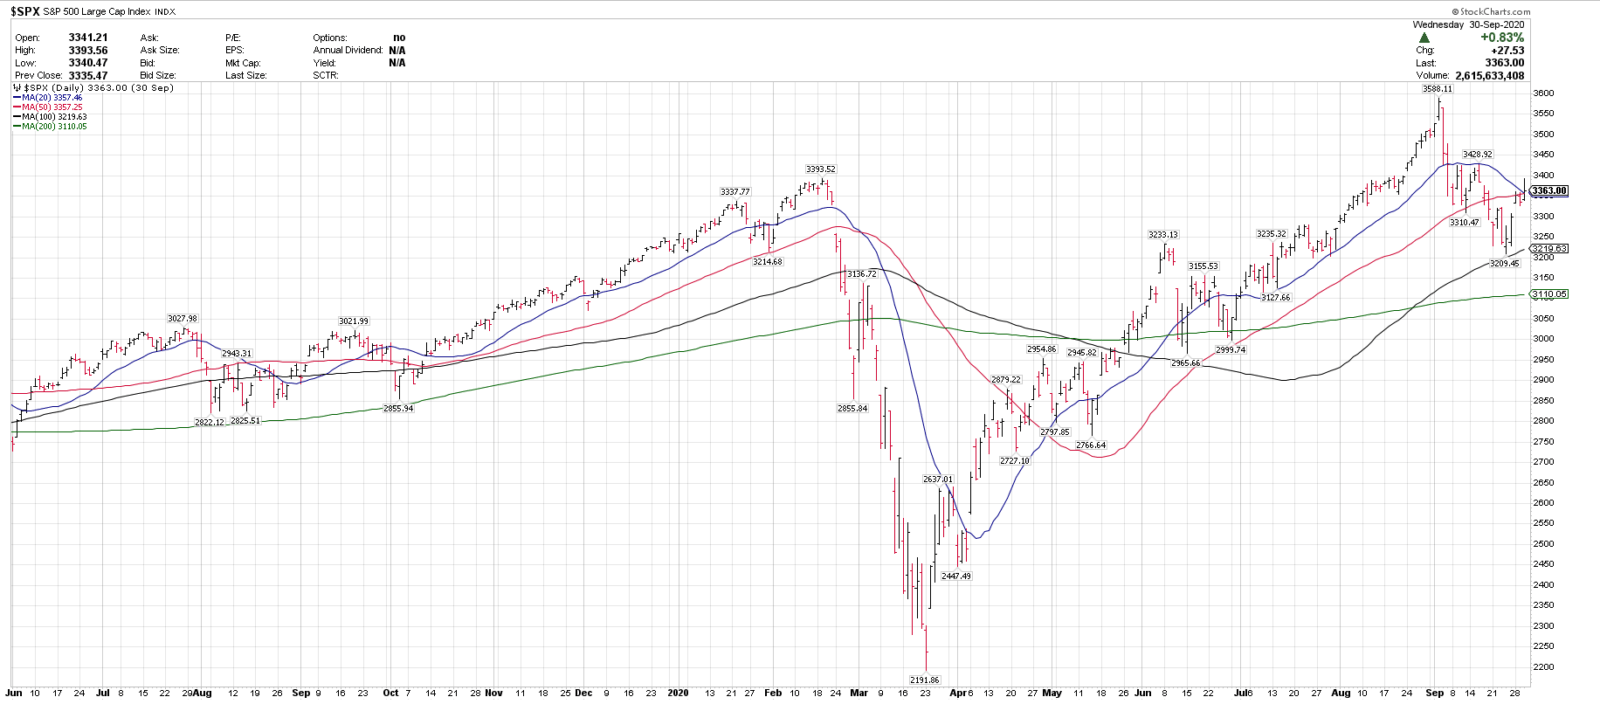
Photo used with permission.