DAILY TREND REPORT
TUESDAY, FEBRUARY 25, 2020
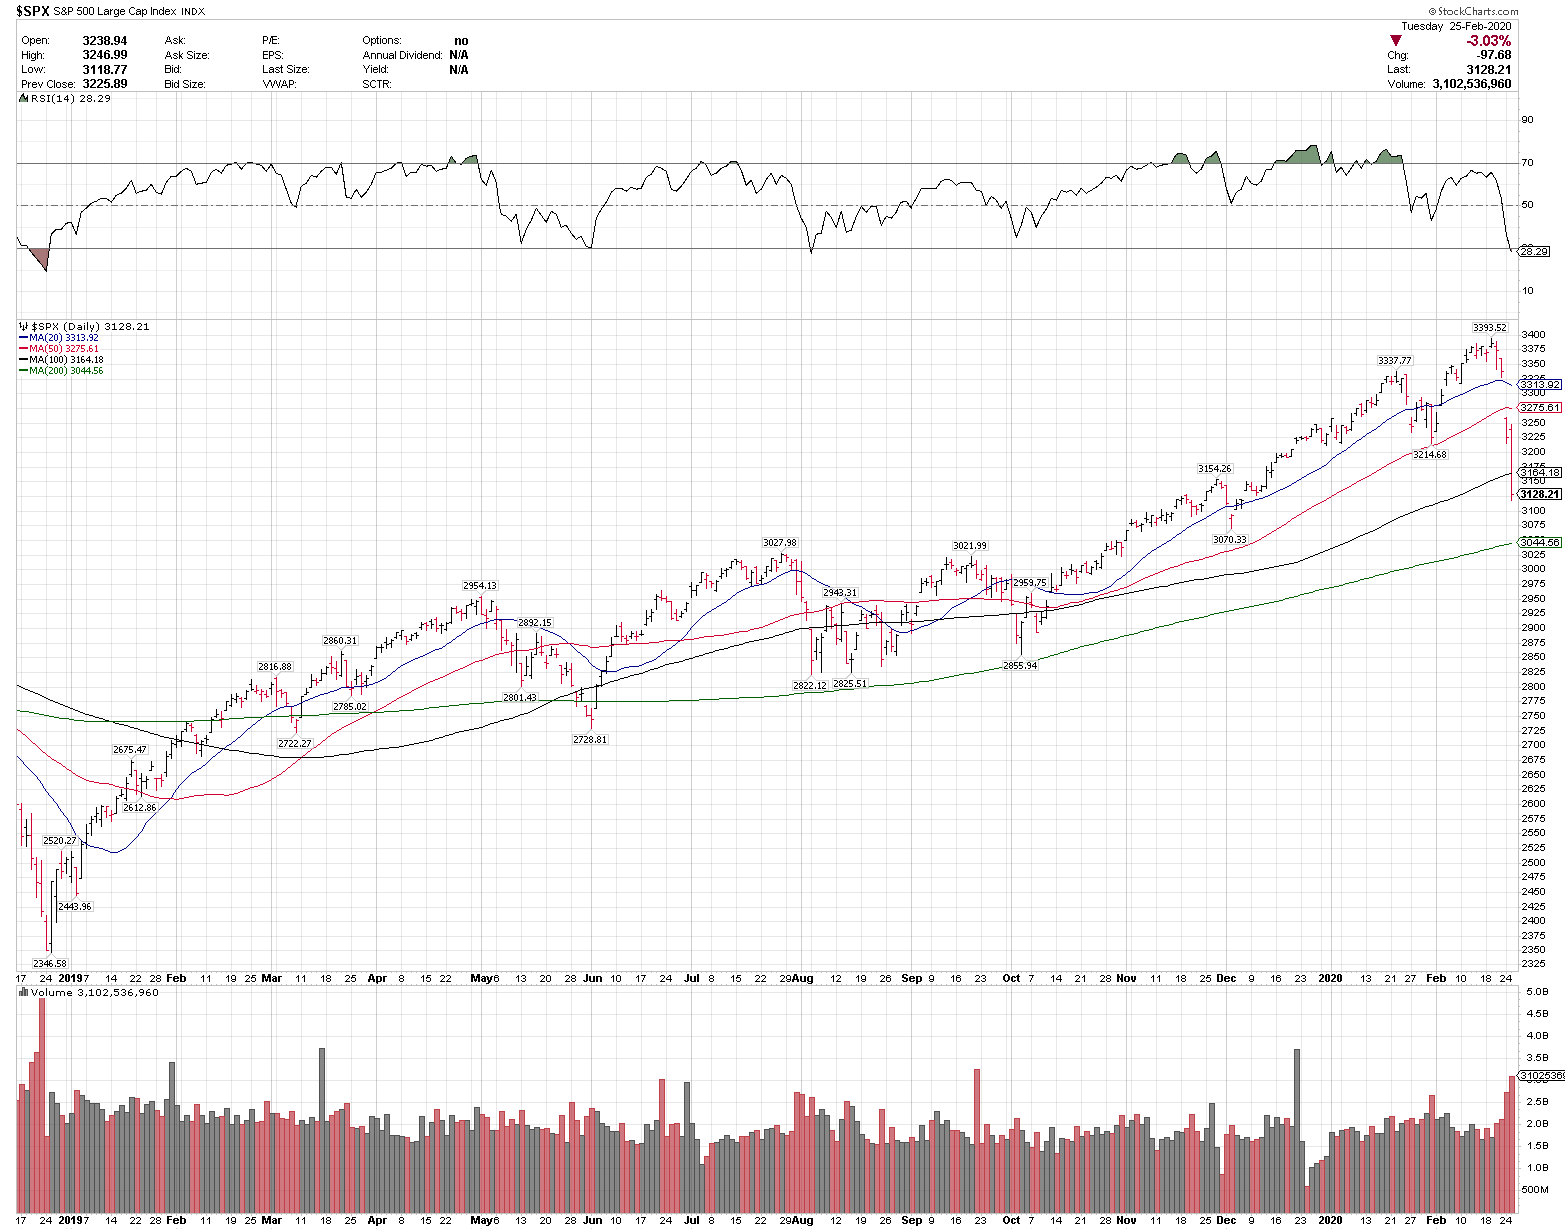
Markets were very weak today, as the selling persisted through any potential oversold market signals, with $SPX -3.03% to close at 3128.21 and Nasdaq was -2.77% to close at 8965.61. As discussed in last nights Report, the oversold signals are not a guarantee, even if higher probability. Price leads and the news flow today seemed to keep stocks under pressure across the board. The Dow Jones Industrials closed under the 200-day moving average, as did Europe, $VGK and Emerging Markets, $EEM. We had exits in $DB and $QCOM, which each represented a small .50% (1/2%) of risk each and $GE was .25% of risk. We did take a new position in $QQQ, which proved to be early so far.
Volatility is a built in characteristic of stocks and markets. One of the reasons they offer higher than average potential longer-term returns is due to their volatility. Whenever I have stops get hit, I treat is as an opportunity to upgrade to a potentially better position at some point. After a market reset, there are often good longer-term ideas to be found, and market resets in 2015/2016 and 2018 led to many big upside ideas.
The key for me, when I recognize the pullback, is to look to minimize the drawdown until the volatility settles.
TODAY’S VIDEO: https://zoom.us/rec/share/wu1eK42gyVJOboGK5U3NBu0eJI–T6a8gSUe_PNfzhlHTpP-3uuzF8_p8A874v4K?startTime=1582674170000
With $SPX trading under 3200, the focus now has shifted to managing open positions and risk. With today’s exits, cash stands at just under 34%, plus a 12%+ weight in $TLT, and 5%+ in $GDX, so more conservative exposure for now. We posted a basic guideline page for Members with how I manage steeper market pullbacks, which can be seen here: https://bluechipdaily.com/standard-newsletter-position/
I always have predefined risk levels, and when they break down, the focus shits to minimize the drawdowns. At this level, I manage open positions and potential exits. If $SPX trades down to the 200-day moving average level, currently 3044, that could trigger some activity. Other than that, for equities, I am observing.
Gold and Miners backed after a very strong move, but they are still a key longer term idea, and the $SPX 3200 new position limit does not apply to that space, REITs and US Treasuries.
China names continue to show good Relative Strength with $ASHR and $KWEB off slightly, still above late January lows and leaders $TCEHY and $NTES were up on the day and well above recent lows.
The Clean Energy space is also holding up very well, with $ALB, $ICLN, $TAN, $LIT, $SQM, $SEDG and $TSLA all above their 50-day moving averages. On any recovery, this is a top focus space for me.
Markets continue to give oversold readings, but price action supersedes any signals, so an oversold signal does not predict any type of bottom. Very oversold signals due set up a possibility for a strong rally, but from what level that can happen is unknown. I am taking a wait and see approach here for now in equities. The S&P 500 Daily RSI is currently under 30, which in an index is often a potential oversold signal.
At the end of the video, I do cover some of the stronger uptrends currently in stocks, and these higher relative strength names are often the first to rebound in any recovery.
We will post the Chart of the Day daily, as that feature is that day’s best technical stand alone idea, and not a directional market call. There are usually always uptrends, and everyone does what they choose to with the information, which is general commentary only.
I will post and email tomorrow’s Chart of the Day by 8:30am.
For intermediate to longer-term traders and investors, these pullbacks, while seemingly not ideal at the time, are most often constructive and open up new entry ideas. The primary trend is still up. Having a process to manage the drawdowns, a good amount of cash to take new opportunities as they arise, and non-correlated positions, like $TLT and $GDX are all part of a sound longer term plan. There are many high quality names that are setting up very well when the time is right.
NEW HIGHS OF INTEREST TODAY:
NYSE: $CLX
NASDAQ: $TLT
Core Markets and Open Positions closing prices are posted below.
Best Regards,
Larry Tentarelli
Publisher
| MARKETS | CLOSING PRICE | CHANGE | % CHANGE | TREND | > 200 D |
| S&P 500 | 3128.21 | -97.68 | -3.03 | U | Y |
| Nasdaq | 8965.61 | -255.67 | -2.77 | U | Y |
| Dow Industrials | 27081.36 | -879.44 | -3.15 | N | N |
| 10-year UST Yields | 13.30 | -.47 | -3.41 | D | N |
| WTI Crude Oil | 49.90 | -1.53 | -2.97 | D | N |
| Gold | 1650.00 | -26.60 | -1.59 | U | Y |
| US Dollar Index | 98.90 | -.38 | -.39 | U | Y |
| *ETFs* | |||||
| SPY | 312.65 | -9.77 | -3.03 | U | Y |
| QQQ | 215.37 | -6.02 | -2.72 | U | Y |
| EEM | 41.34 | -.33 | -.79 | N | N |
| VGK | 54.29 | -1.26 | -2.27 | N | N |
| GLD | 153.70 | -2.79 | -1.79 | U | Y |
| GDX | 29.97 | -1.08 | -3.48 | U | Y |
| TLT | 151.05 | .80 | .53 | U | Y |
| USO | 10.40 | -.34 | -3.17 | D | N |
| NYSE New Highs | 77 | ||||
| Nasdaq New Highs | 50 |
OPEN POSITIONS