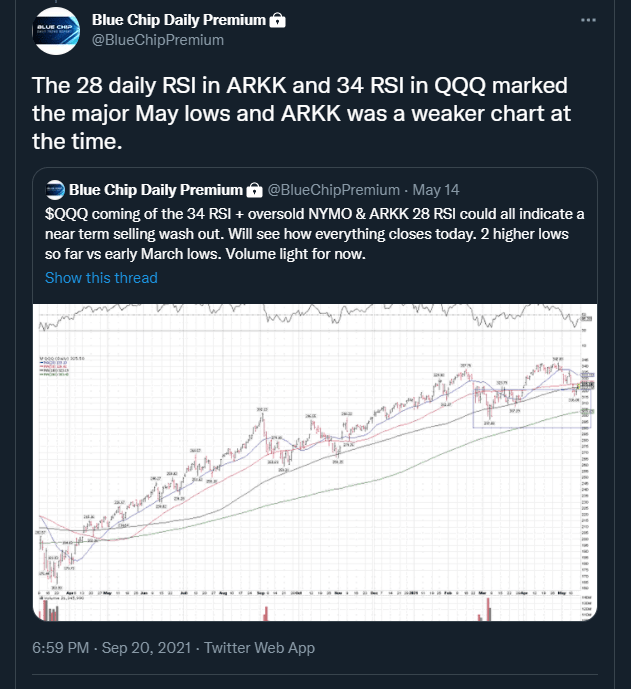
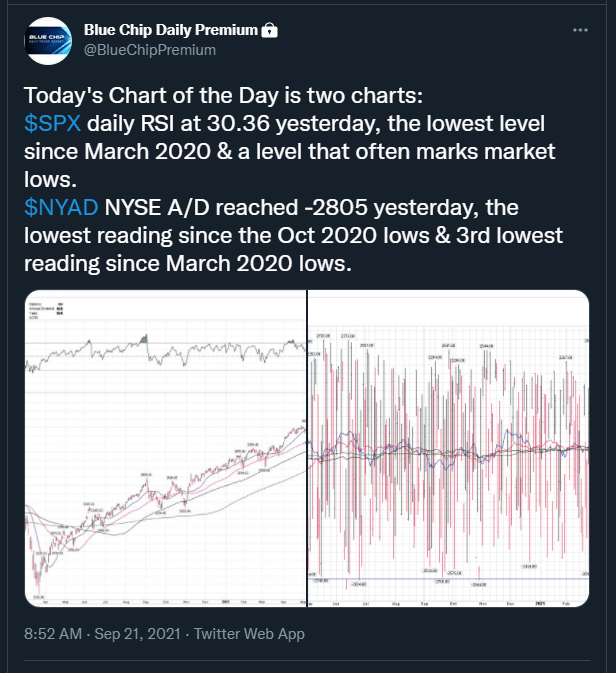
In this brief educational blog and video, I will take you through real-time charts and screenshots of how I identified a major oversold low in stocks and the S&P 500 (SPX) on Monday, 9/20/21, while many in the media were calling for much further selling.
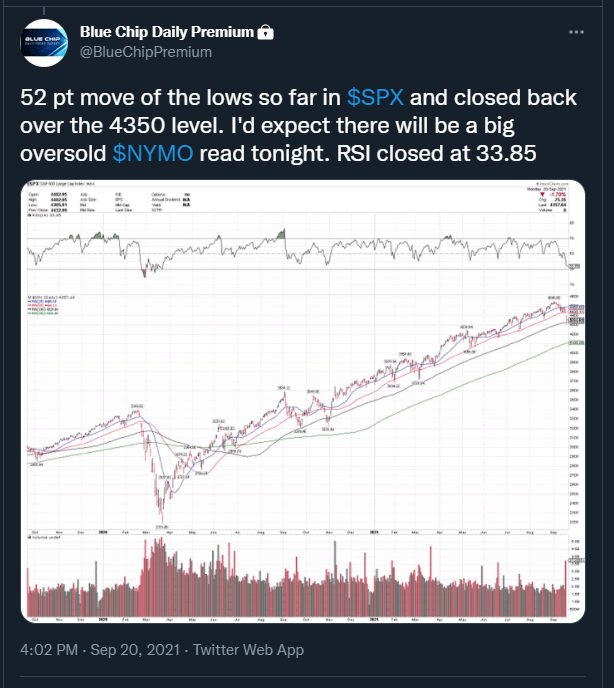
This is not a prediction that SPX made a final low for this cycle, but it did make a sharp recovery move so far, as well as many leading large cap stocks.
I used the data and charts available, as well as my daily trading experience over 23 years, to analyze SPX at these levels.
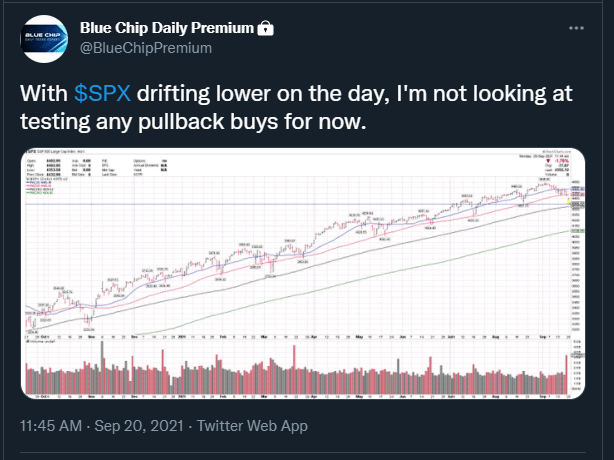
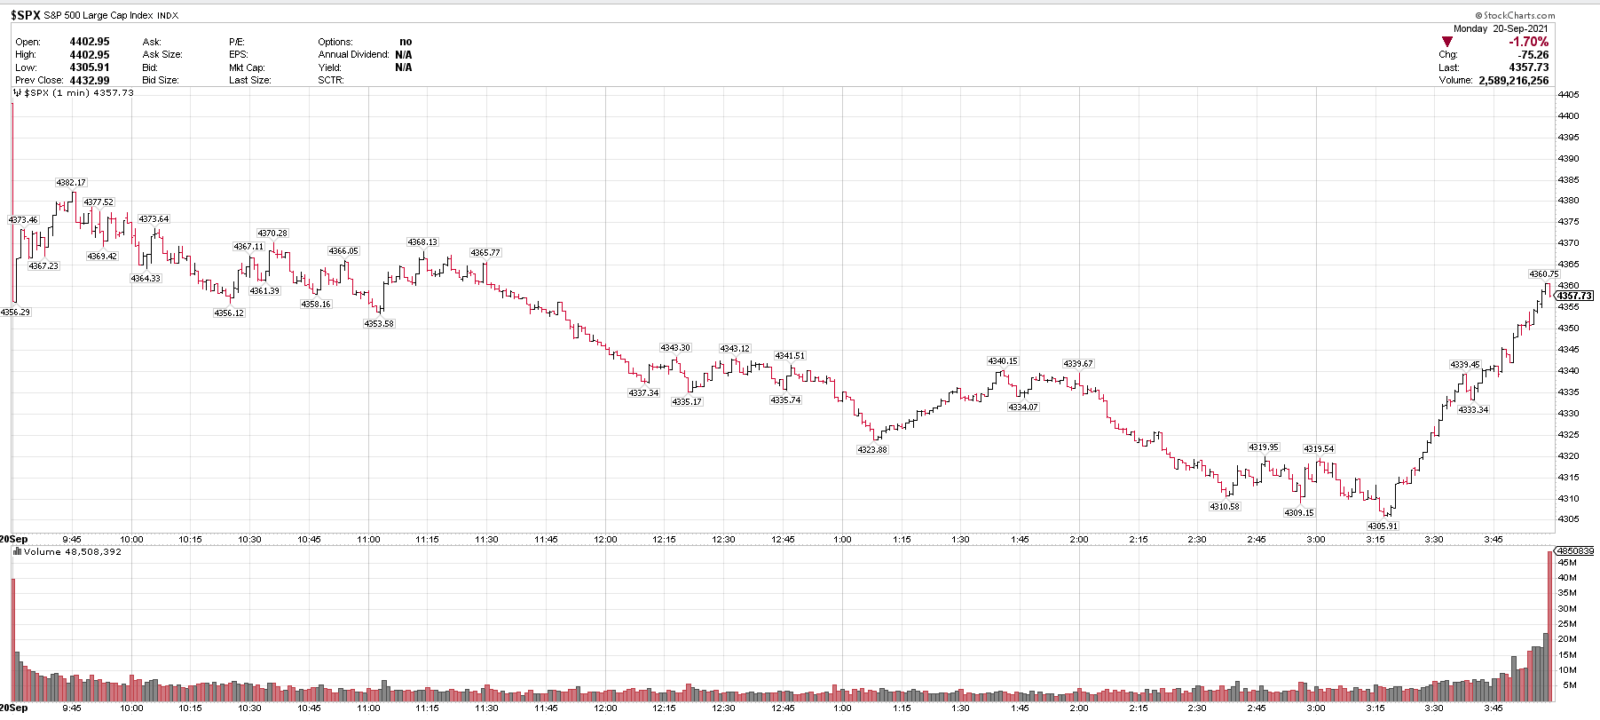
SPX DAILY CHART
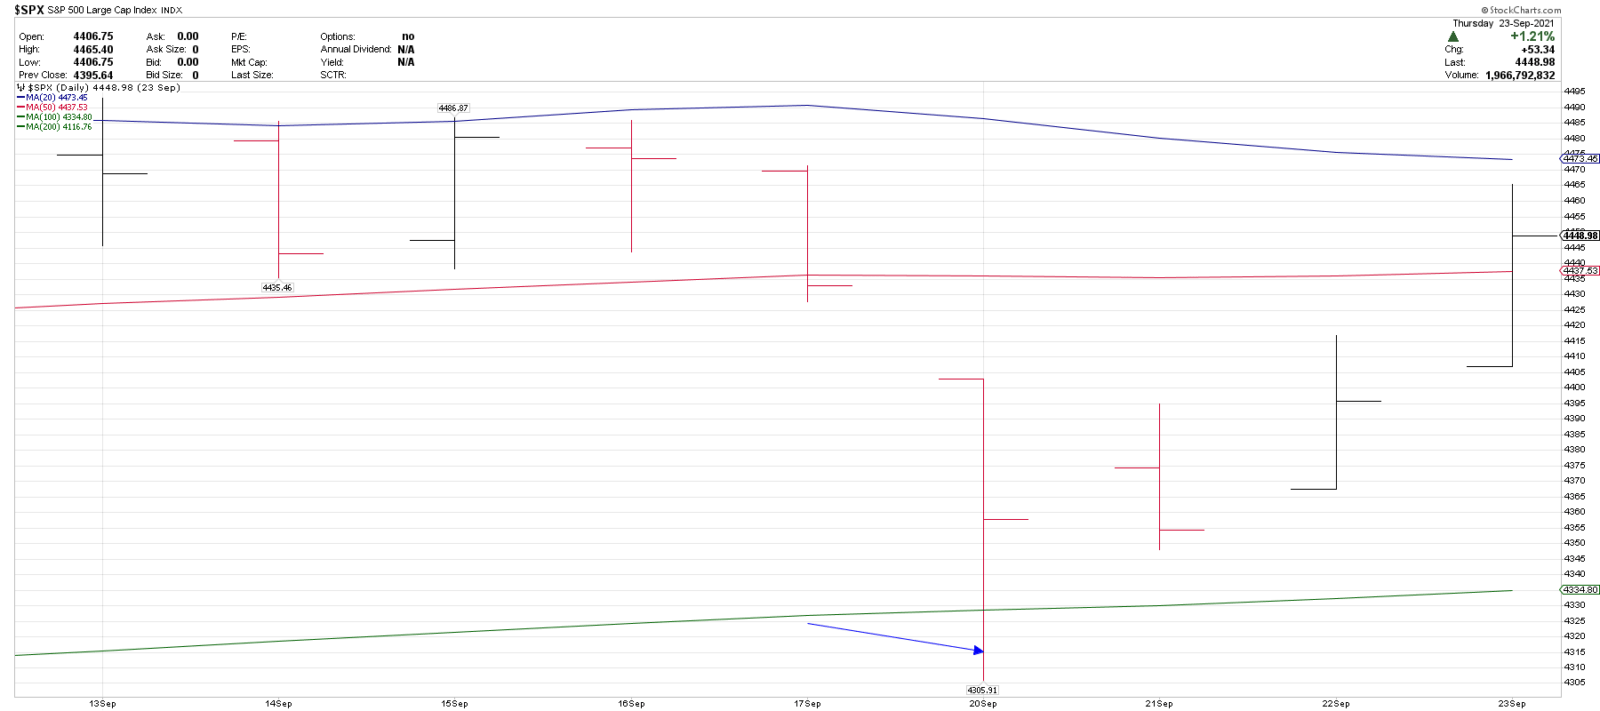
MONDAY, SEPTEMBER 20, 2021
SPX LOW JUST AFTER 3:15 PM ON 9/20/21
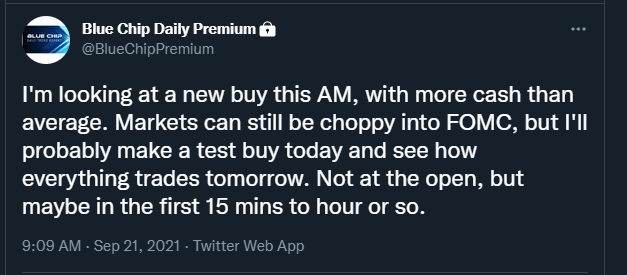
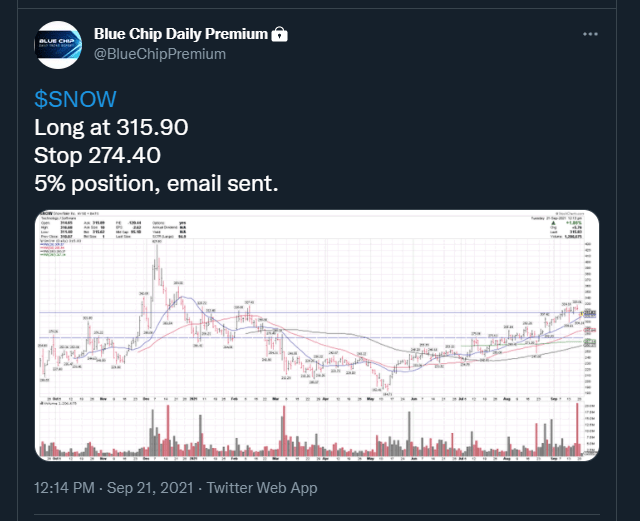
TUESDAY, SEPTEMBER 21, 2021
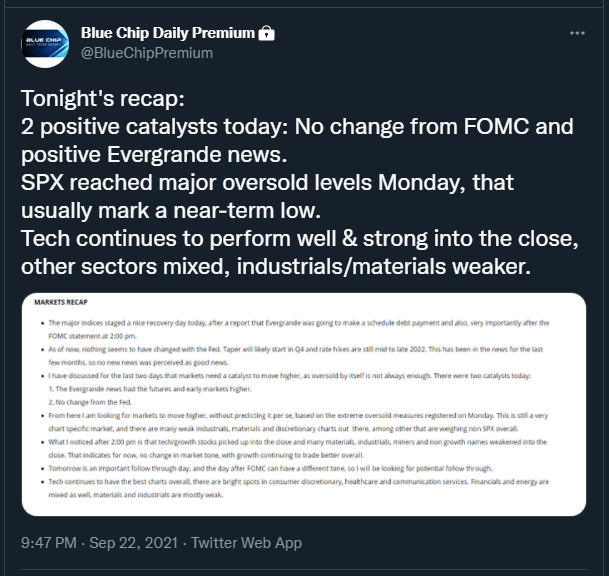
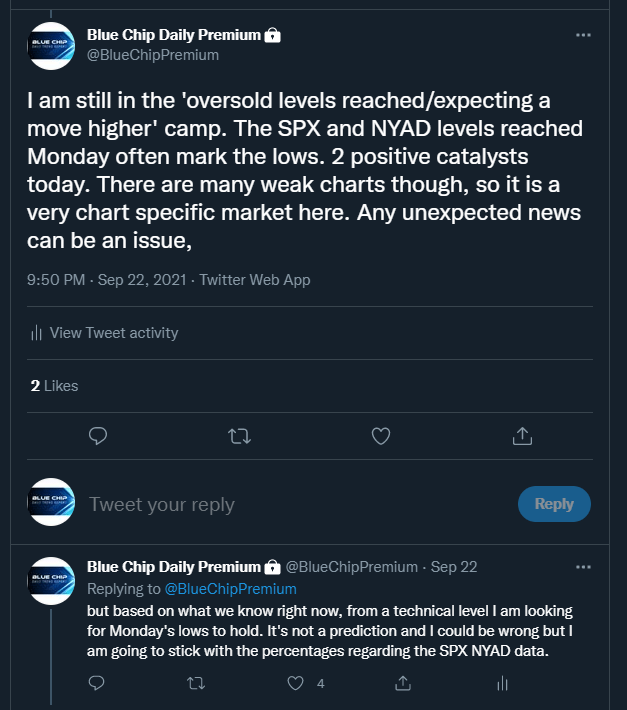
WEDNESDAY, SEPTEMBER 22, 2021
THURSDAY, SEPTEMBER 23, 2021
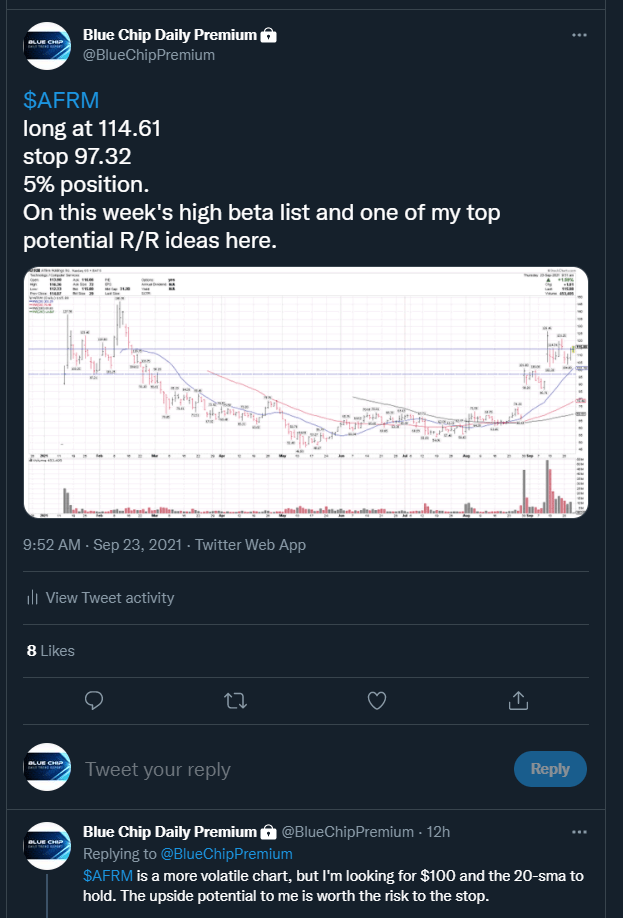
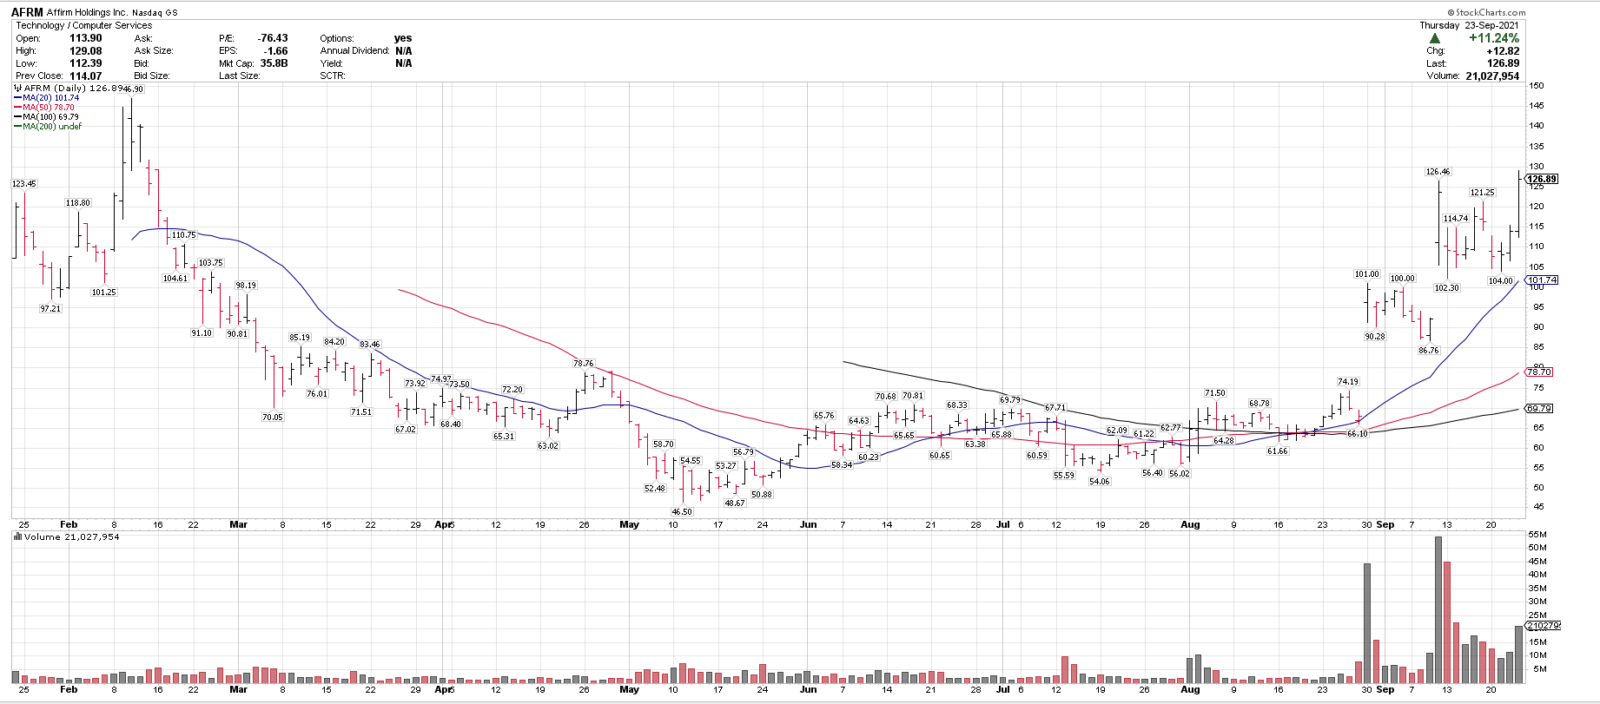
AFRM closed the day at $126.89, +11.24% on the day and the #1 performing large cap out of 907 stocks.