THE TREND IS YOUR FRIEND
One of the first lessons that traders are taught, is the age-old maxim, “the trend is your friend”.
At first, when we want to question and challenge everything, we don’t always listen to this wisdom and we spend a lot of time trying to fight trends but buying into downtrends or shorting into uptrends. Although, like any random action, this could work in the short-term, we often find out that in the longer-term, while most trends come to an end at some point, they can persist longer than many think they will.
WHAT IS A PRICE TREND?
Price trend can be determined by a trader or investors time frame. My time frame is generally intermediate to longer-term. I can often hold winning positions for 3-6 months, or much longer, based on market conditions. I don’t do any type of short-term trading at all. I don’t day-trade or swing-trade. I am looking for much bigger moves and trends, so I focus on a 3-6 month plus time frame.
I focus on daily price charts, generally with a one-year look back and will often dial into weekly and monthly charts to get a bigger picture trend view.
For my timeframe, and uptrend is comprised of a series of higher highs and higher lows on the daily chart, usually with 4 rising moving averages, 20, 50, 100 & 200 day-simple moving averages (sma) are my parameters.
A downtrend is comprised of a series of lower highs and lower lows, most often below declining moving averages.
Uptrends often have layers of price support below and downtrends often have layers of overhead resistance above.
Trend analysis can be much more detailed in it’s explanation, but doesn’t need to be. It also doesn’t require countless technical indicators to identify it.
TRADITIONAL UPTREND CHART
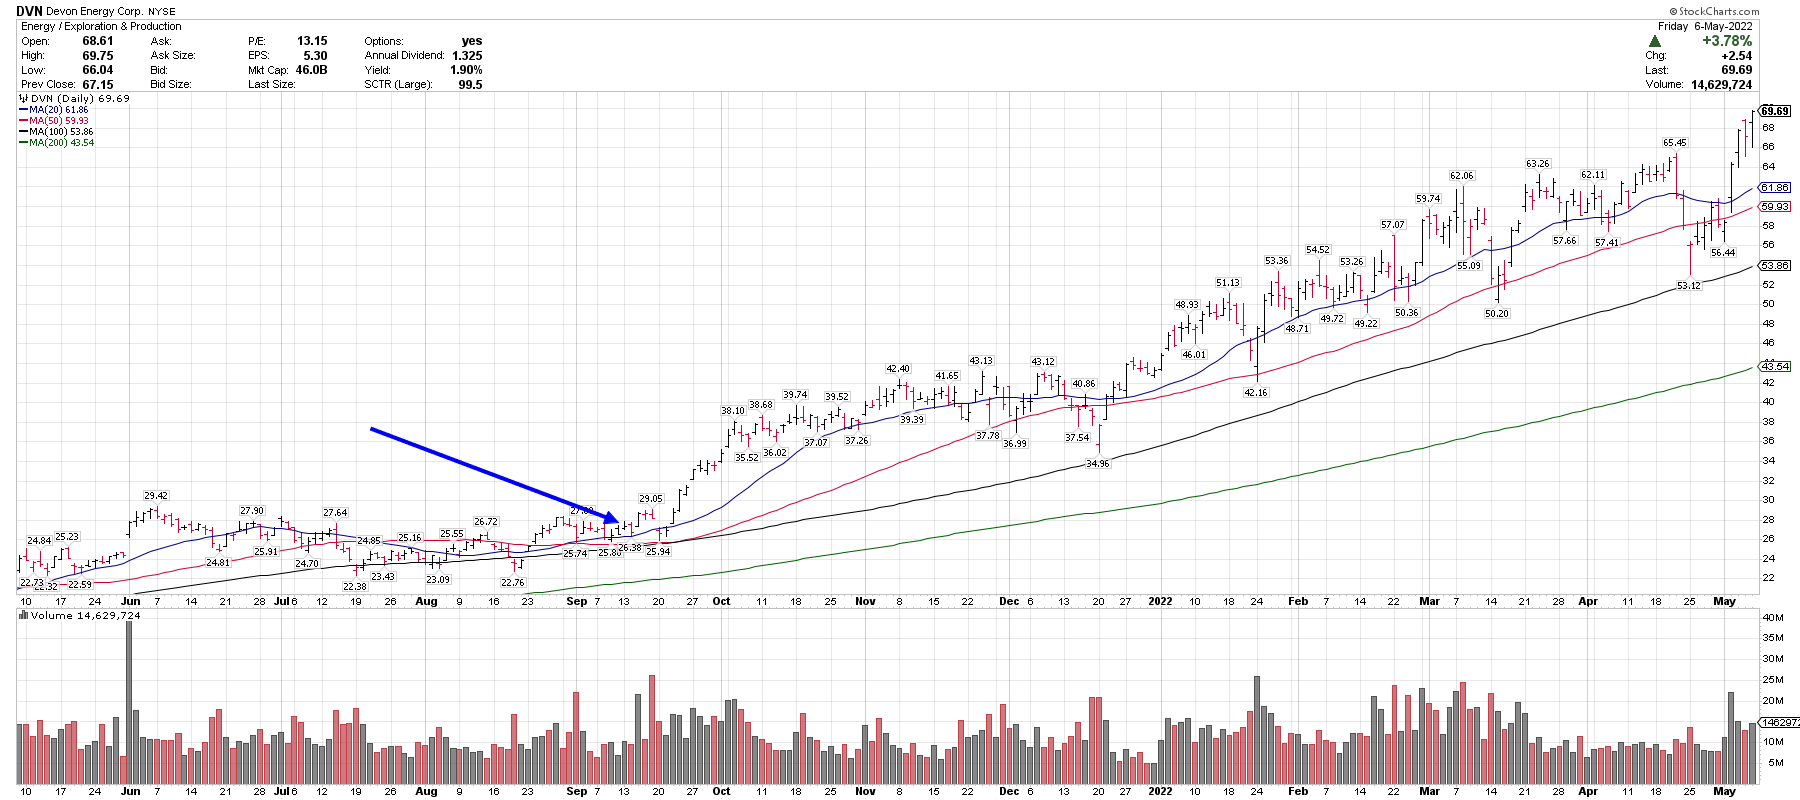
- The chart below of Devon Energy (DVN) shows a clean price uptrend.
- A series of higher highs and higher lows above 4 rising moving averages.
- The chart also shows multiple layers of price support below.
- This chart shows that buyers have continued to pay higher prices for the stock and continued to come in at higher lows to support the stock, classic bullish price action.
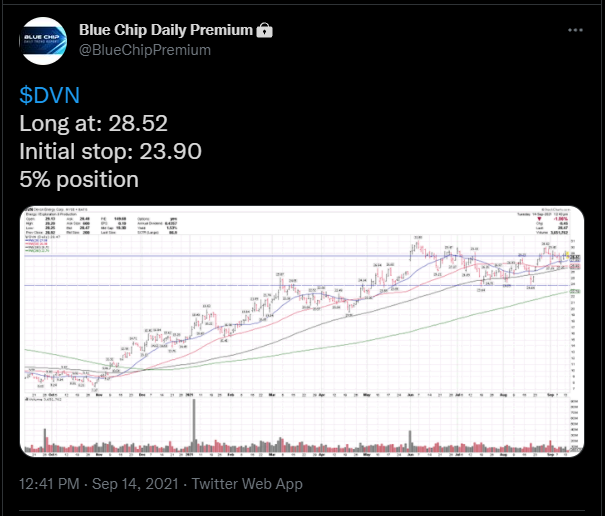
- I took a long position in Devon Energy on 9/14/21 and alerted Blue Chip Daily subscribers in real-time.
- That position is currently +144% since the buy point. I have taken some gains along the way and raised the trailing stop.
TRADITIONAL DOWNTREND CHART
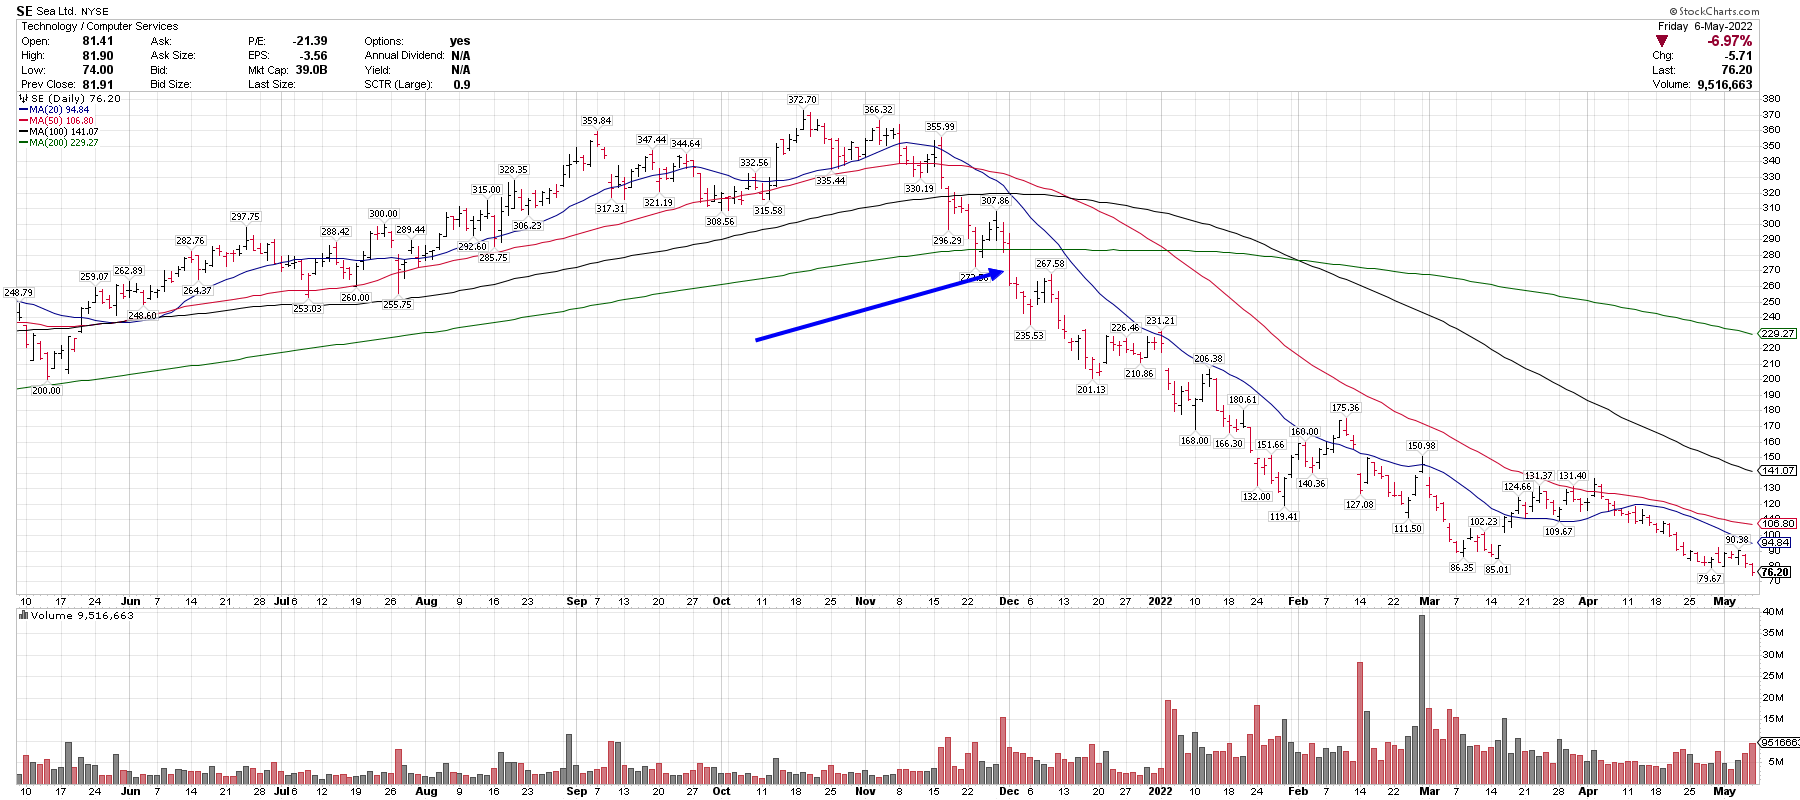
- The chart below of Sea Limited (SE) shows a clean price downtrend.
- A series of lower highs and lower lows, developing below 4 declining moving averages.
- The charts also shows multiple layers of potential sellers above that have paid higher prices and might look to reduce their losses as they get closer to even.
- This chart also shows that new sellers are willing to sell at lower prices and buyers are not willing to support the stock.
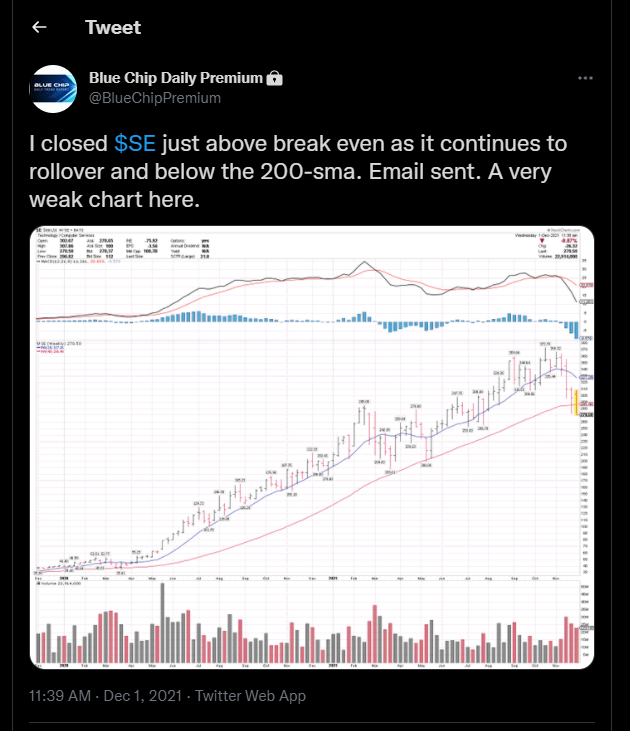
- I closed my long position in Sea Limited on 12/1/21, just over 271. It made a recent low at 76.20.
- My sale in December, and alert to Blue Chip Daily subscribers, helped to avoid a 71.8% drawdown in this stock, so far.
KEY TAKEAWAYS
- Be sure that you are aware of your own timeframe and that your price charts coincide.
- For intermediate to longer-term holders and position traders, there is no need to focus on intraday charts.
- Study past chart winners and losers to identify how trends unfolded in both directions.
- On the long side, look for chart uptrends and when charts start to break down, consider reducing or eliminating exposure.
- Strive to develop a consistent and repeatable process, based on price trends.
LEARN MORE ABOUT BLUE CHIP DAILY AND OUR VIP 30-DAY TRIAL OFFER HERE: Learning – Blue Chip Daily Trend Report