I want to share with you three charts that I am focused on following yesterday’s CPI report:
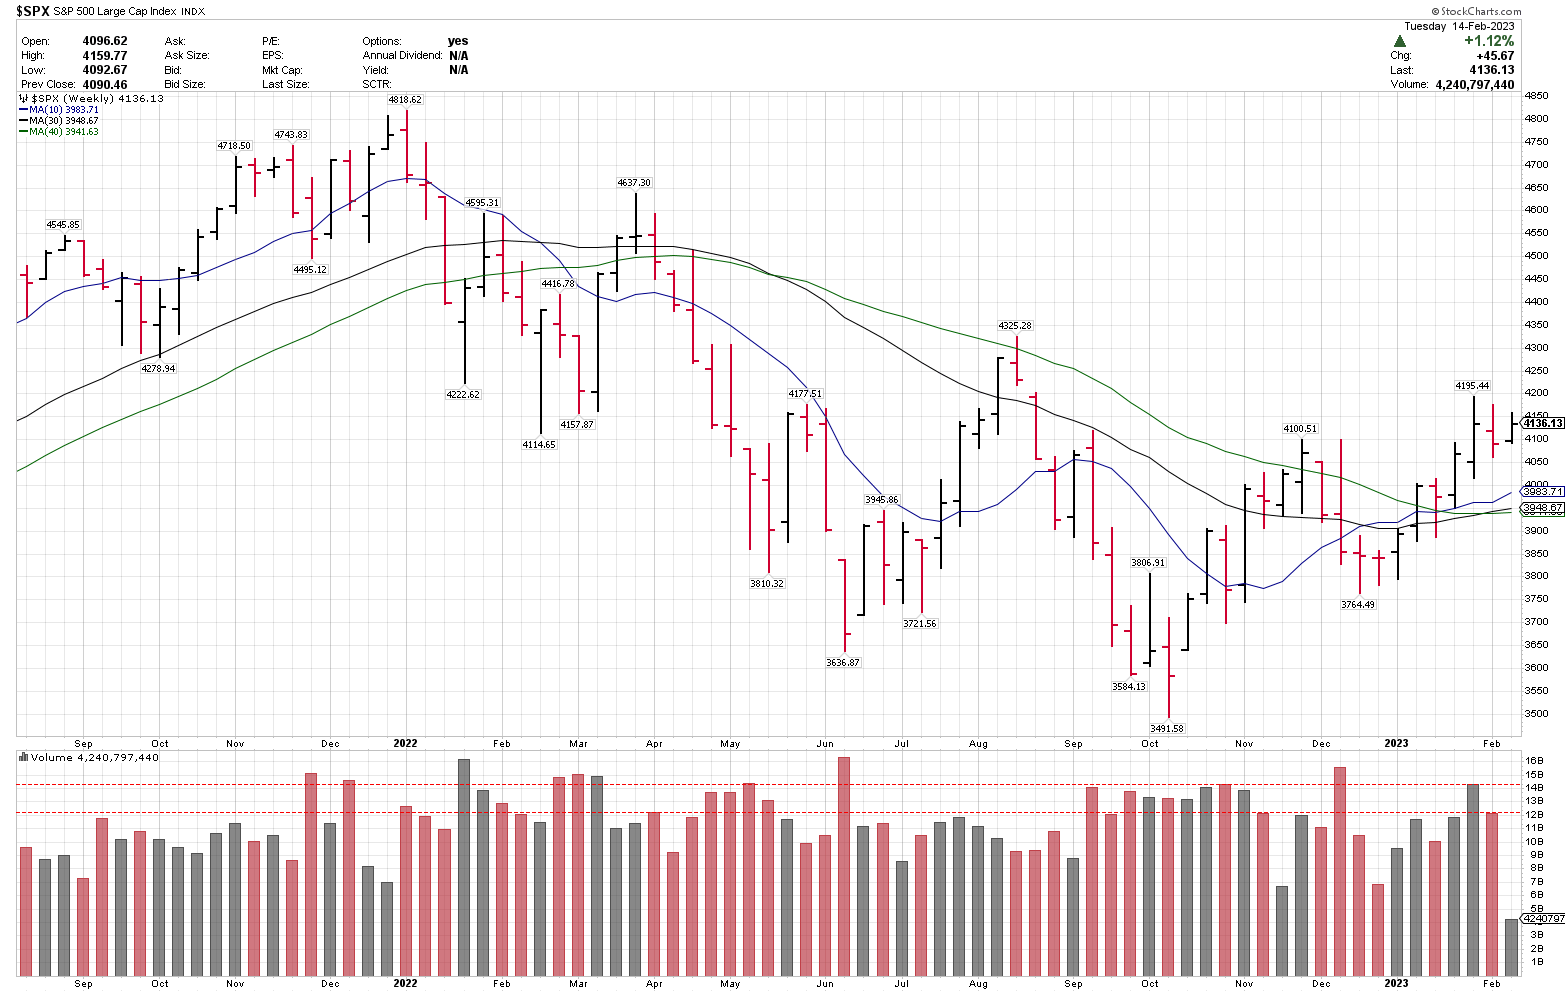
1. The S&P 500 Weekly Index Chart (SPX):
- Weekly trend signals have been improving, with the 10-week and 30-week moving averages recently crossing the 40-week moving average to the upside.
- (SPX) recently traded to 4195.44. This marked a higher high vs the November high, following a higher low in December vs October lows.
- (SPX) pulled back on lower volume last week, vs the prior week’s upside test to 4195. The 4195 upside test week was the highest upside weekly volume since March 2022.
- The 3900-4000 level represents key trend support on any potential pullbacks.
- A close over 4200 could open up the chart to a test of the 4250-4300 range.
- We believe that the US Dollar index and 10-year US Treasury bond yields will be key factors. More on these two charts below.
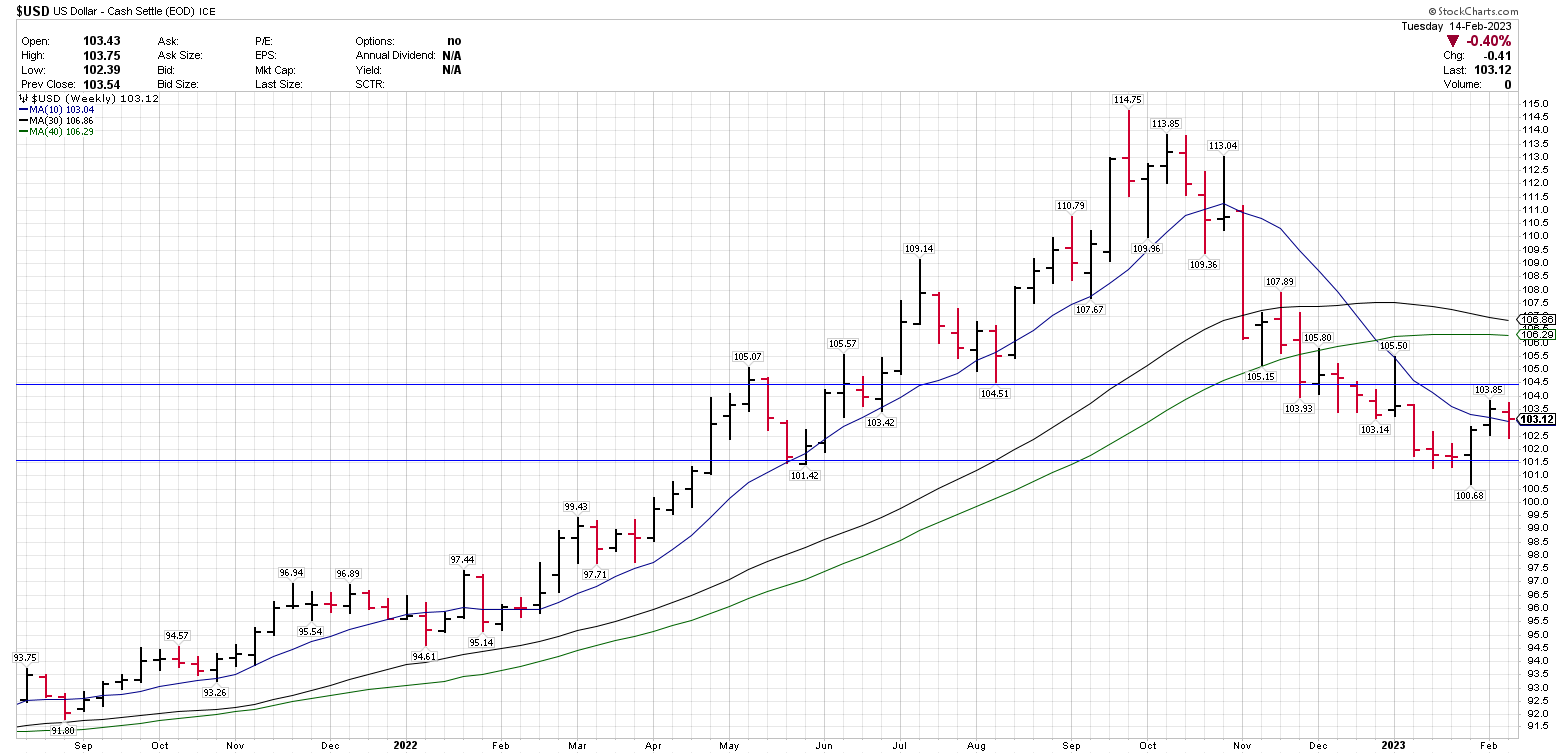
2. US Dollar Index (USD)
- The US Dollar Index (USD) recently peaked in September at 114.75.
- Lower (USD) over the last 5 months has coincided with the recent recovery move in (SPX).
- After trending lower since September, (USD) reversed higher recently after a much higher than forecast US jobs (NFP) report on February 3.
- (USD) reclaimed the 10-week moving average last week for the first time since October 2022.
- Higher than forecast inflation readings and/or above forecast labor reports could keep support for (USD).
- A close above 104.50 for (USD) would be more cautionary for stocks and metals. Below 101.50 would be a positive.
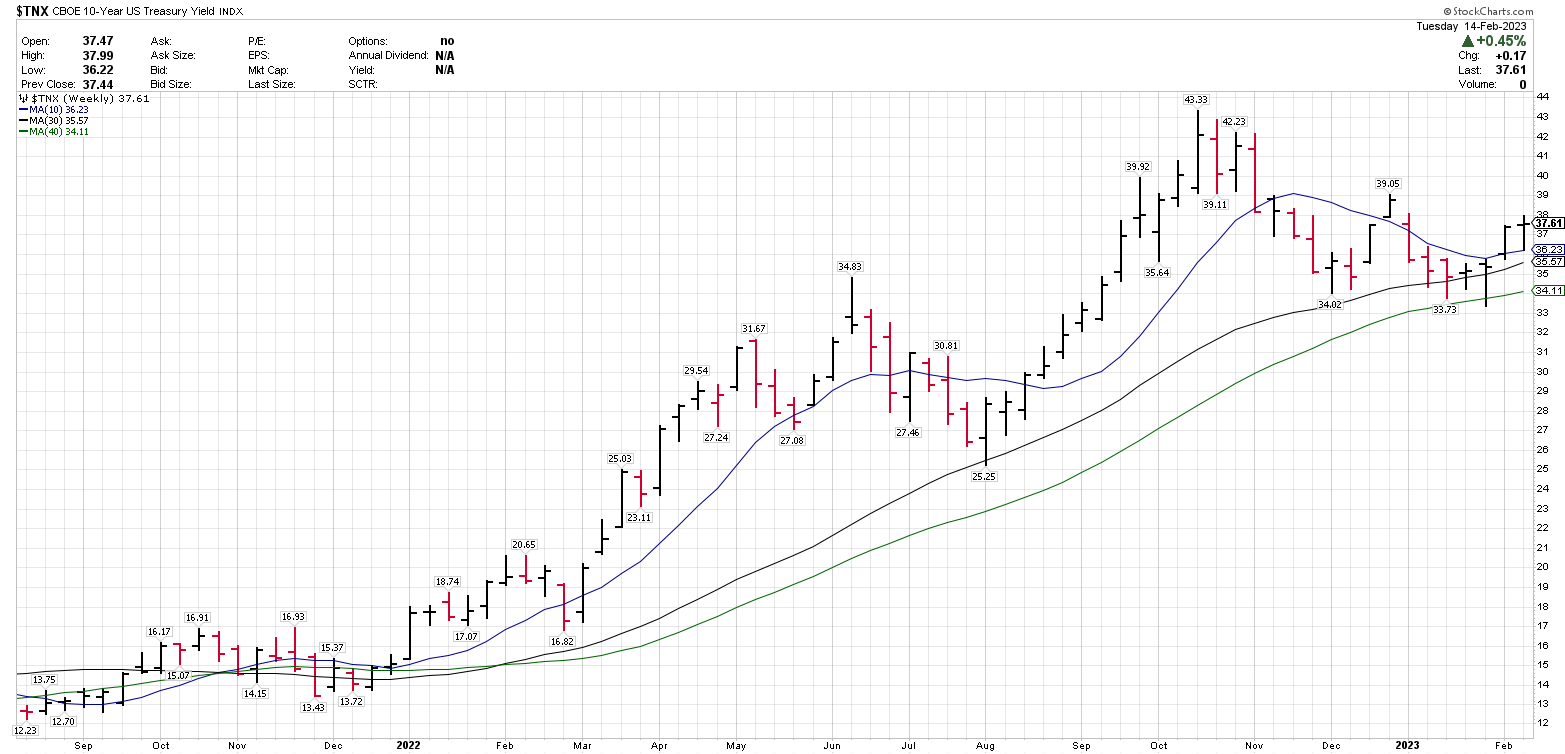
3. 10-Year US Treasury Yields (TNX)
- (TNX) recently peaked in October, following the US Dollar recent high in September.
- The rising 40-week moving average has held on a closing basis since December 2021.
- Lower (TNX) over the last 4 months has coincided with the recent recovery move in (SPX).
- (TNX) reversed higher recently after a much higher than forecast US jobs (NFP) report on February 3.
- 3.90 and 4.00 are key overhead levels to watch.
- Any breakout above 4.00, if so, could put pressure on stock indices and Treasuries. If below 3.50, that should be a positive.
We share technical and trend insights like these on a daily basis with Blue Chip Daily subscribers for major markets as well as over 800 large-cap stocks and 50 leading tracking ETFs.
Start a trial Membership here: Blue Chip Daily Trend Report
See full Members benefits here: Blue Chip Daily Trend Report
See some or of our recent technical alerts here: Best Ideas – Blue Chip Daily Trend Report