- Every trading day we post a Chart of the Week idea for subscribers, pre-market. Every Sunday we post a Chart of the Week idea.
- We post it on the members X page, to our website and email it.
- Every posted idea is then tracked in real-time with a link to the actual X post, in the “Date” column.
- Every idea also get a posted “stop loss” level which closes the idea.
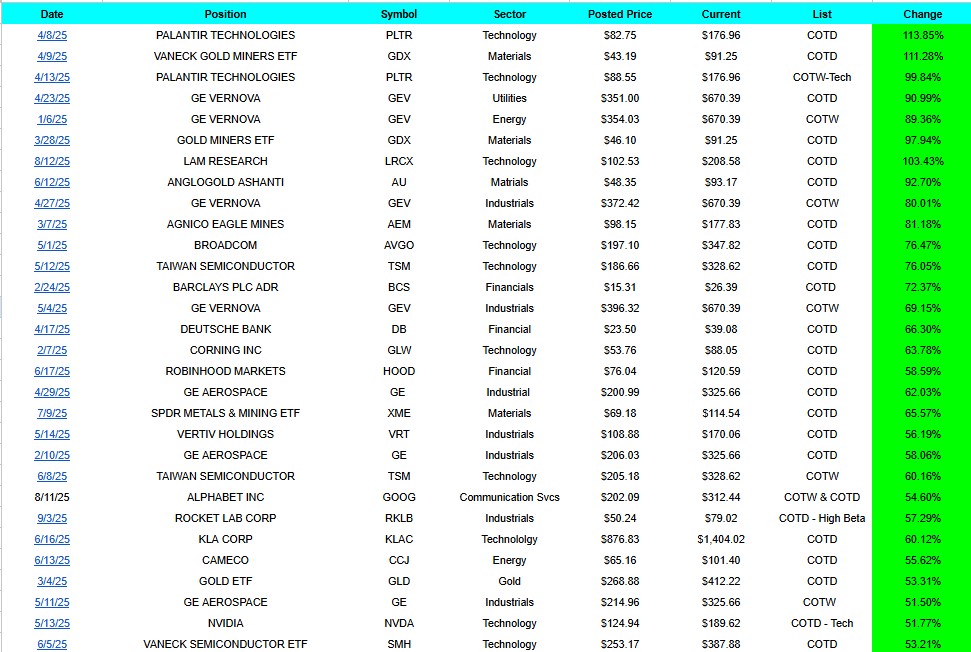
- Our 2025 top 30 posted Chart of the Day or Week ideas are below, directly from our members website.
- Of the top 30 picks, the average return is +72.76% (as of 1/6/26, when we compiled this data).
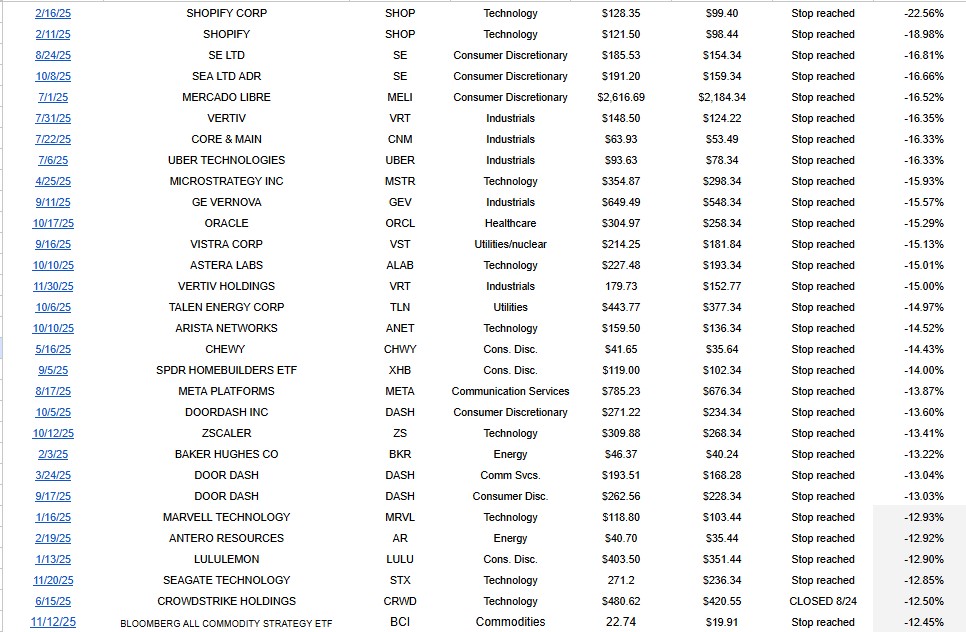
- The bottom 30 picks for 2025 are listed below on this page, and they averaged -15.49%.
The bottom 30 Chart of the Day or Week performers from 2025. Almost all have been stopped out and reached the posted stop loss level.
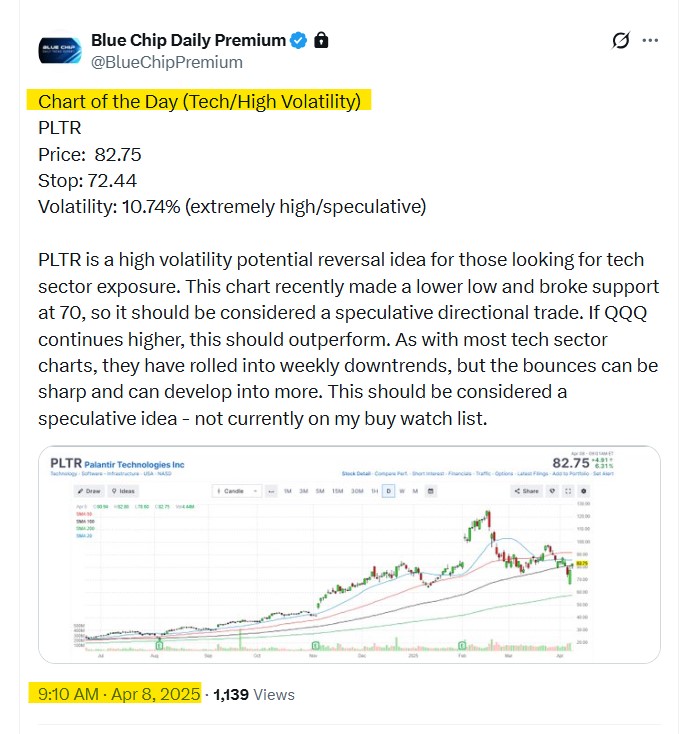
- Below is a sample Chart of the Day post.
- The idea is posted every morning, pre-market and then tracked on the website for all members to see at any time.
- We link the post in the tracking sheet, so that members can reference the idea at any time.