ORIGINAL BLOG DATE 2/29/20
This Blog discusses how we used price, moving averages, exits and position sizing to avoid being taken down in the majority of last week’s selloff. The break below 3200 on the S&P 500, $SPX, was the key signal. In the video and $SPX chart below, I will explain why.
From our premium Twitter feed, on Tuesday, Feb. 25. 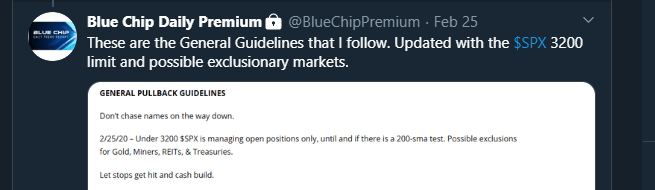
To be clear:
1/ We did not predict or call a top, that is not how I trade.
2/ We had a drawdown in the accounts, stops were hit and we gave back some gains.
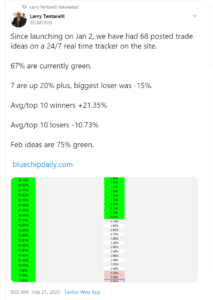
3/ YTD all of our real-time posted positions and profit scale alerts are -1.25% in what is the steepest selloff since 2008, and one of the sharpest weekly selloffs ever. $SPY -7.95% YTD. (We post all open positions and daily Chart ideas in real time on a 24/7 Member access tracking spreadsheet).
4/ Coming into the selloff, on 2/21, our posted Best Technical Ideas and Open Positions were at a 67% win rate with the average winner being larger than the average loser by 39%, and more active users of our best ideas list booked larger wins, including 7 ideas each up over 20%.
5/ We took some smaller pre-calculated ETF test positions that were stopped out small this week.
6/ The S&P 500 index is coming of one of it’s worst weeks ever, with the index ETF $SPY, -7.95% year-to-date, and was -11.16% for the week.
(To preserve the value to our Members, I share some basic past posts below of general market commentary. Any position specific or current/future commentary and analysis is always Members only access.)
One key point that I have made over the years is that there is no reason to predict market tops constantly, when in reality it will always show up in the charts, with price breaking down below key price levels and moving averages. As fast as last week’s selloff happened, price gave signals all week, and reactive price based traders like myself were able to respond and drastically reduce any drawdown, with no prediction necessary, simply reactive price analysis.
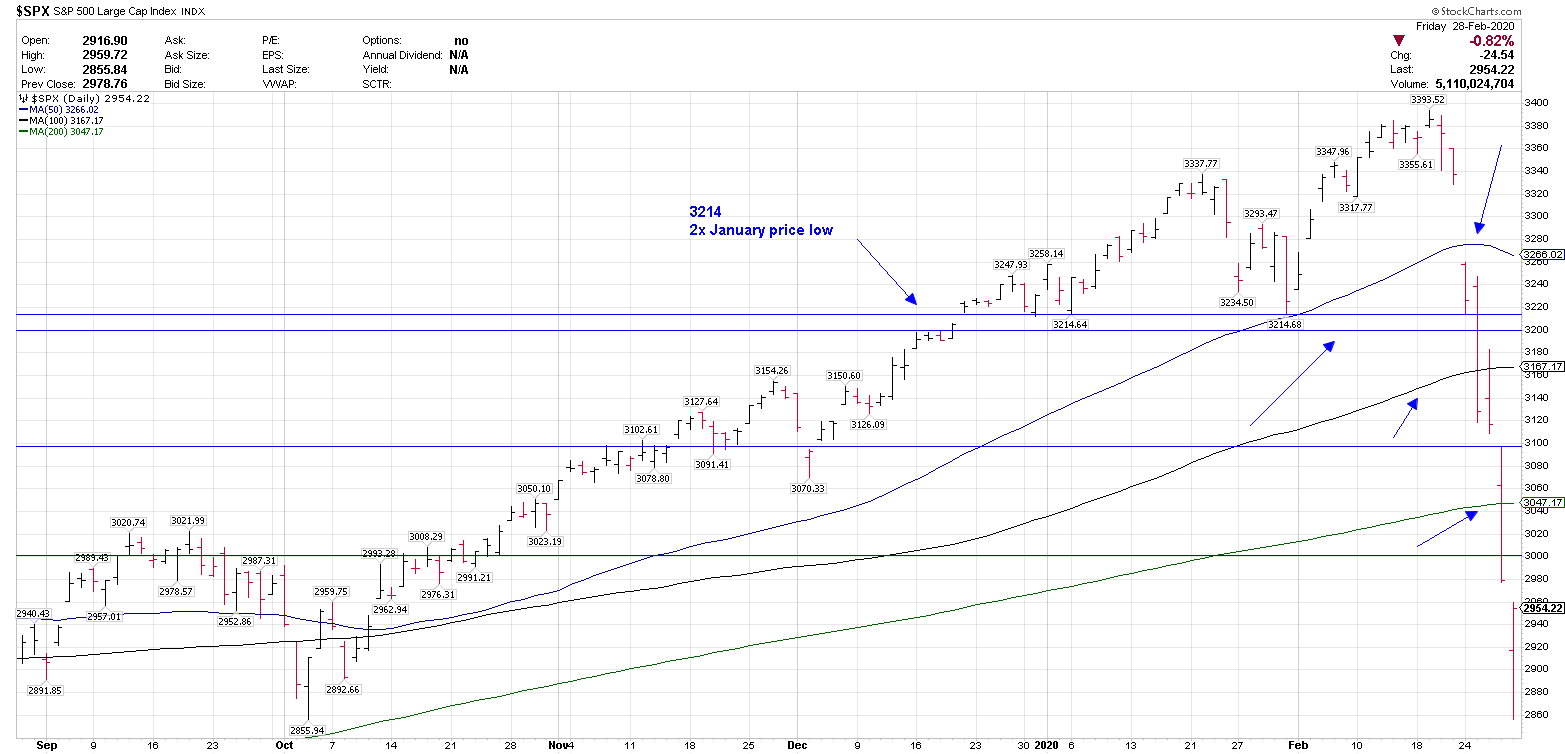
1. First trend signal of weakness – 50-day moving average break, first time since October 2019.
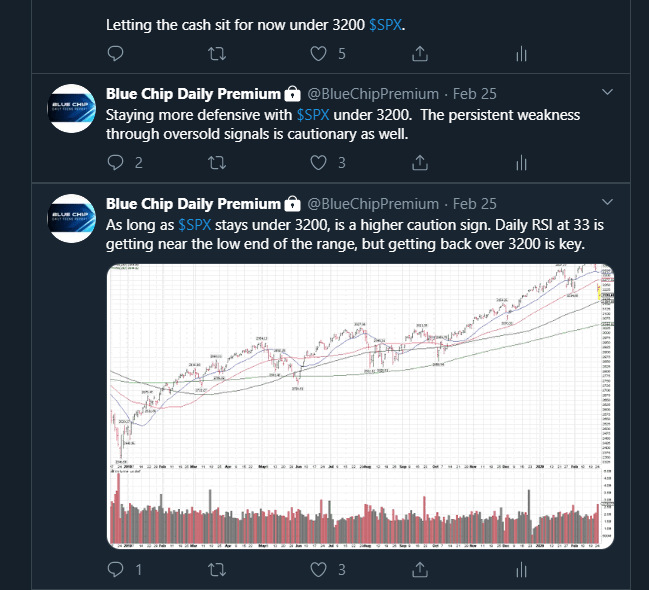
2. The key 3214 price level, which held as the low twice in January, broke down.
3. When $SPX 3200 broke down, the trading plan switched to full defense, follow exits, let cash build, no single stock buys at all.
4. Below the 200-sma, another sign of weakness.
5. Below 3000 $SPX. more breakdown
2/19 Raised stops in open positions to reduce open risk.

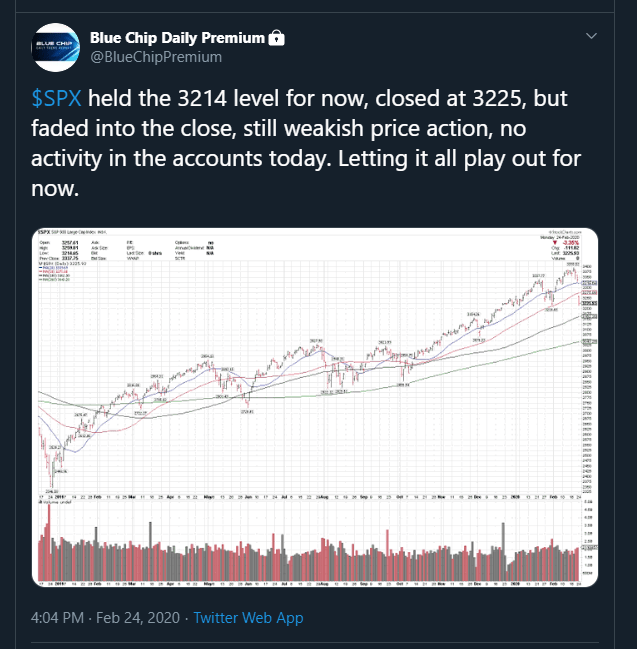
2/24 Pre-market: Looking to see if the key level at 3214/3220 level holds if tested. 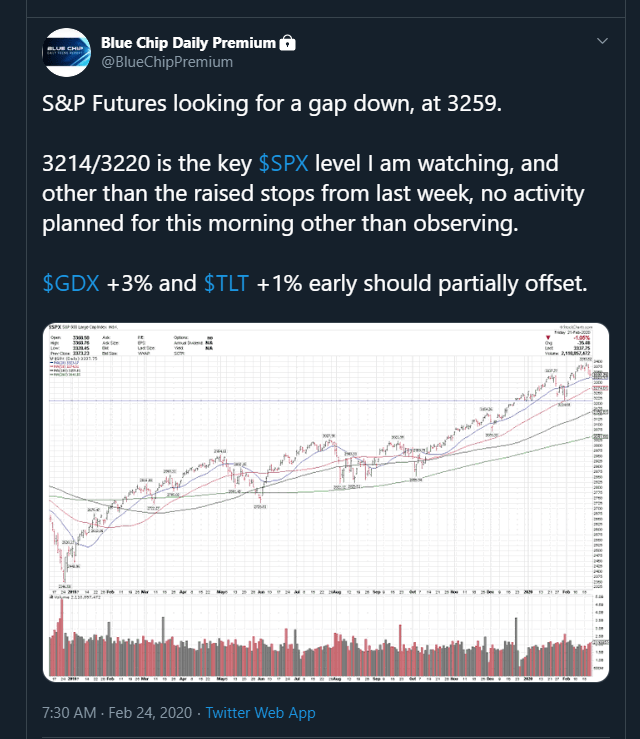
2/24 After the close. Exact test and hold of 3214 for now.
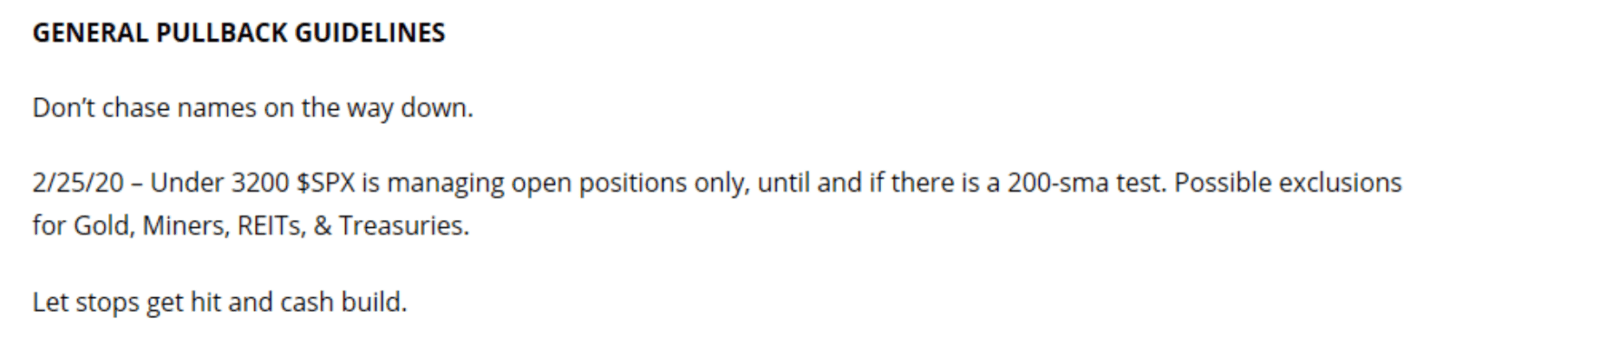
2/25 $SPX under 3200 is a full defensive call. No single stock buys, let any exits sit in cash. Small risk ETF testers only at this point.
2/25/20 WEBSITE POSTED GENERAL PULLBACK GUIDELINES (this is the shortened version of the full post)
2/19/20 – Stops raised to reduce open risk.
The market pullback from the all time high at 3393, to the full defensive signal at 3200 was a total of -5.6%.
We came into the week, off the highs, at 32% Cash/USTs, and let it build substantially along the way as this 2/26 Blog explains. https://bluechipdaily.com/dont-try-to-be-hero-using-key-price-levels-to-avoid-downtrends/
3 small risk ETF tester positions at key levels were all stopped for small risk.
No single stock buys since $SPX 3360.
The key point of this Blog is to illustrate how a trader or investor can stay long in an uptrend and shift gears and manage risk using a well planned, rules-based technical process, based on price, price levels, moving averages, stops and careful position sizing.
We have a full scope plan coming into this week, with scenarios for multiple market outcomes.